Excel Basics Every Economist Should Know

Introduction
In the world of economics, data analysis is fundamental. Whether you’re analyzing market trends, forecasting economic indicators, or conducting empirical research, Microsoft Excel stands out as an indispensable tool. This article covers the essential Excel basics for economists that will enhance your ability to manipulate data, create insightful models, and communicate findings effectively.
Why Excel is Essential for Economists
Excel offers a flexible platform with powerful features designed for data organization, statistical analysis, and visualization. Economists rely on Excel because it supports complex calculations, scenario modeling, and easy-to-understand presentations of data. Here, we’ll dive into core skills every economist should master.
Data Organization and Management
Efficient data management is the first step in economic analysis. Learning how to organize data properly in Excel helps prevent errors and improves workflow.
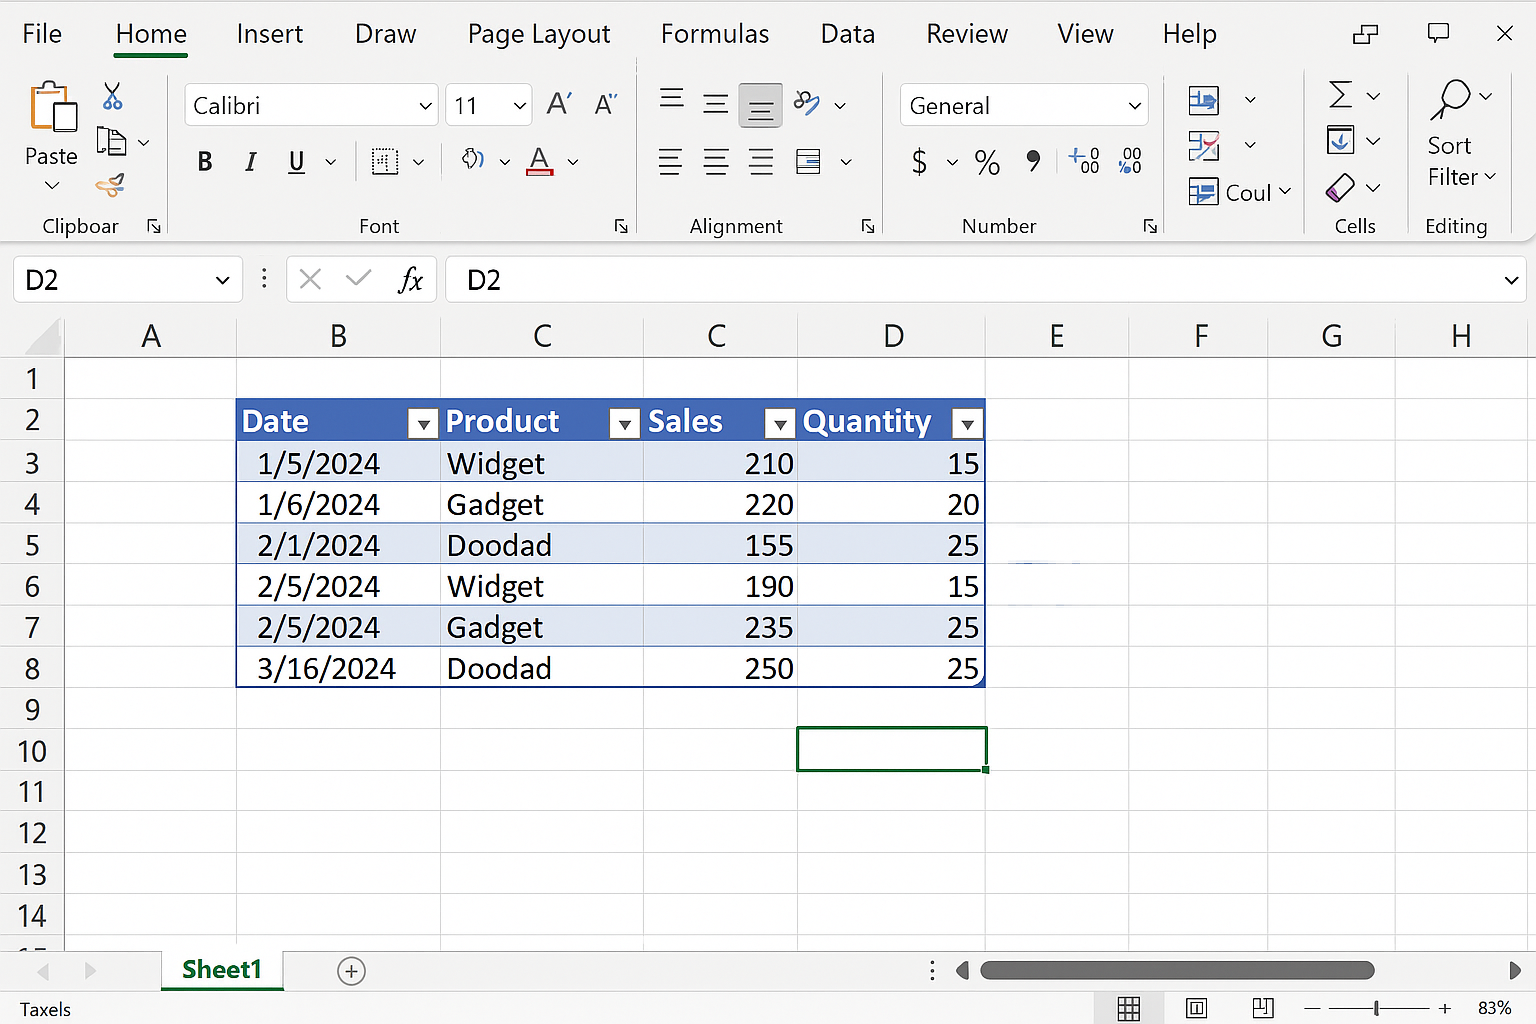
- Using Tables: Convert ranges to tables by selecting your data and pressing Ctrl + T. Tables automatically expand when new data is added and support sorting and filtering.
- Sorting and Filtering: Easily sort data by columns or filter specific criteria to focus on relevant data subsets.
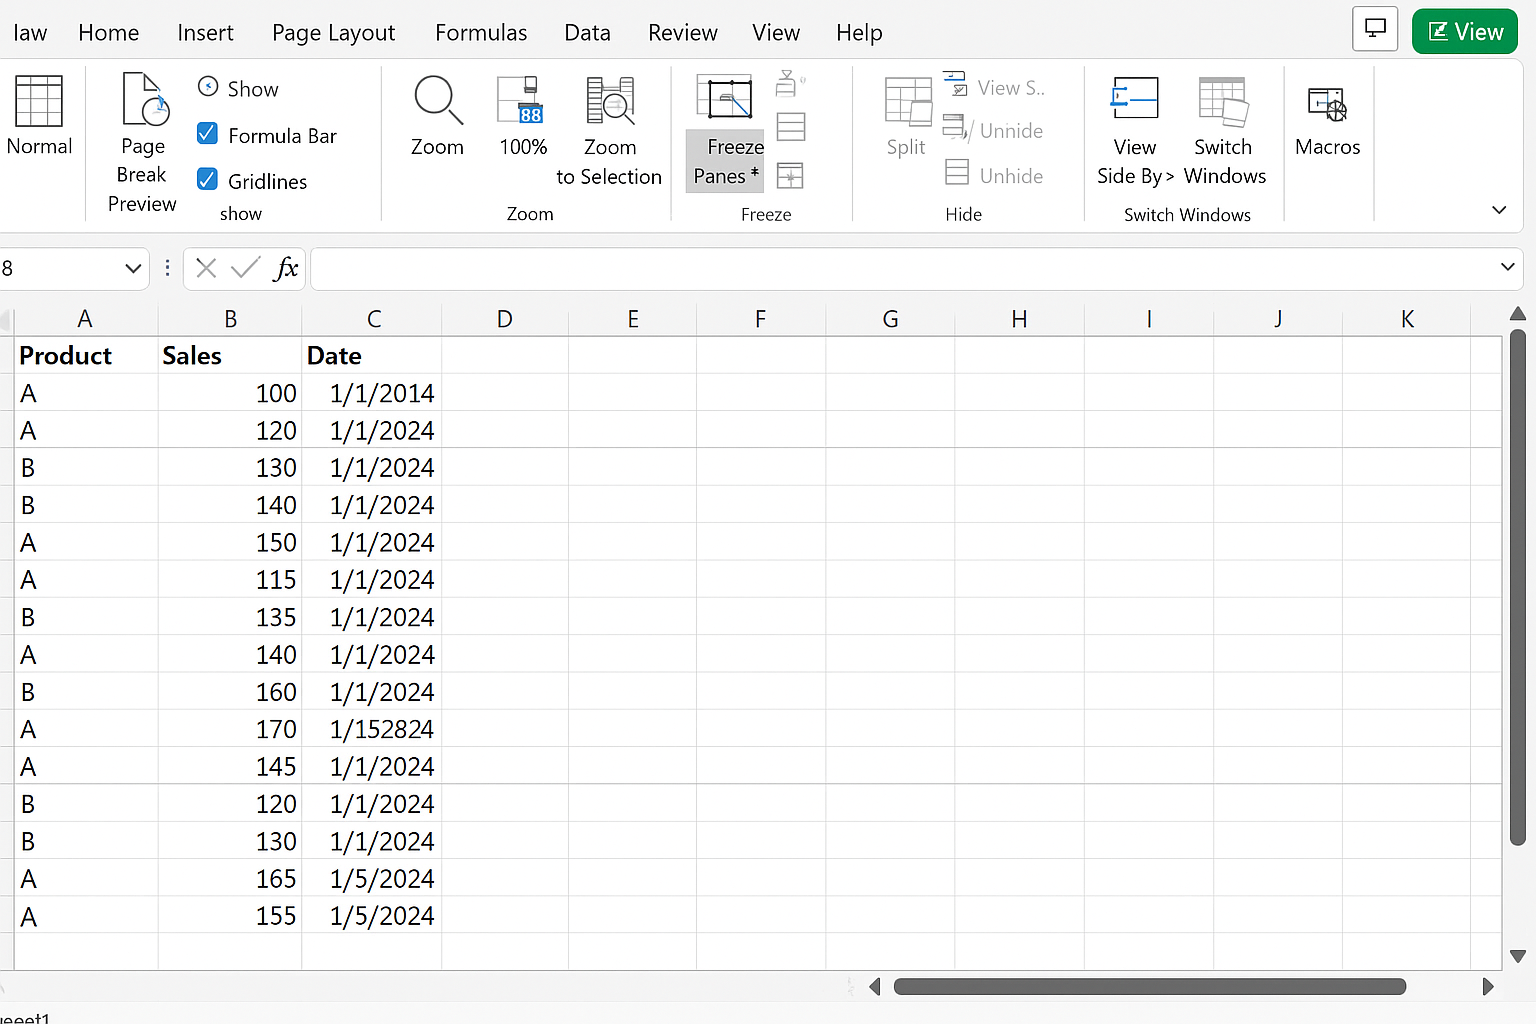
- Freeze Panes: Keep headers visible while scrolling large datasets by navigating to View > Freeze Panes.
Key Excel Functions for Economists
Excel has many functions that economists use regularly. Understanding these will enhance your analysis:
- SUM, AVERAGE, COUNT: Basic statistical functions to calculate totals, means, and counts.
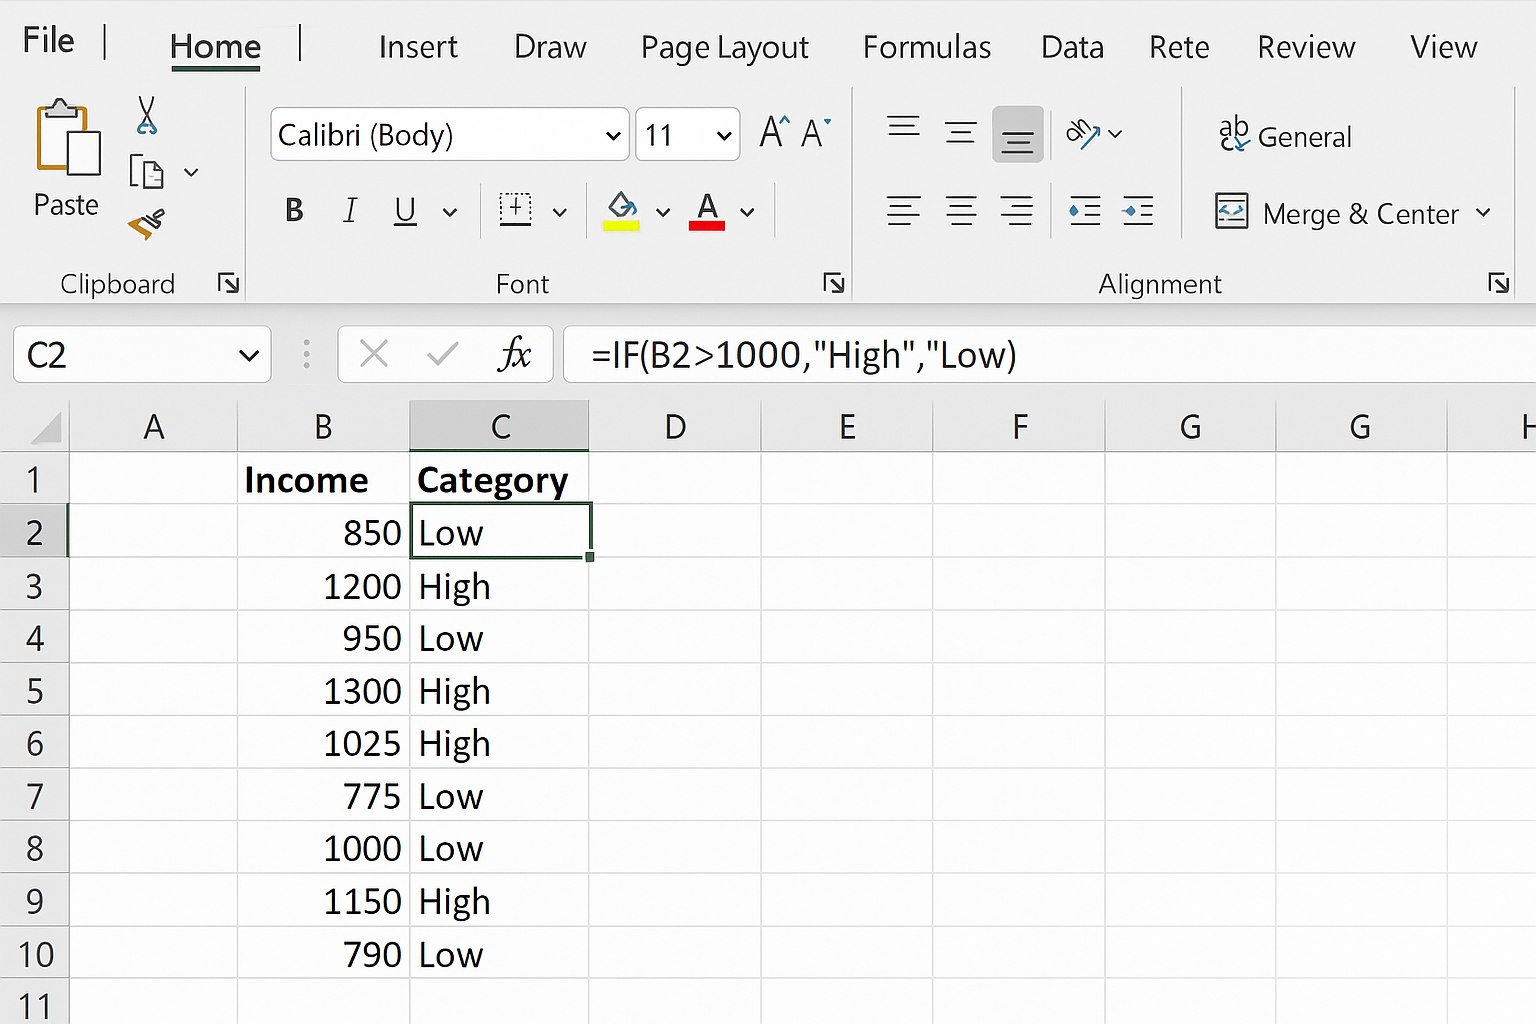
- IF Statements: Use conditional logic to analyze data subsets. For example,
=IF(B2>1000,"High","Low")categorizes data based on income. - VLOOKUP and INDEX/MATCH: Retrieve data from large tables efficiently. For example, use
=VLOOKUP(A2,DataRange,3,FALSE)to find an economic indicator’s value. - PMT: Calculate loan payments, useful in financial economics. Syntax:
=PMT(rate, nper, pv). - STDEV.P and STDEV.S: Calculate population and sample standard deviations for statistical analysis.
Creating and Using Charts
Visualizing data is critical for economists to communicate trends and insights. Excel provides various chart types:
- Line Charts: Ideal for showing economic indicators over time, such as GDP growth rates.
- Bar and Column Charts: Compare data categories like unemployment rates by region.
- Scatter Plots: Explore relationships between variables, such as inflation rates versus interest rates.
To insert a chart, select your data range, go to the Insert tab, and choose the desired chart type.
Basic Economic Modeling with Excel
Economists often build models to forecast or simulate economic scenarios. Excel’s built-in features support this through:
- What-If Analysis: Use tools like Data Tables, Goal Seek, and Scenario Manager to test how changes in variables affect outcomes.
- Regression Analysis: Use the Analysis ToolPak add-in to perform linear regression, helping you understand relationships between variables.
Example: Simple Linear Regression
Assume you want to analyze how consumer spending depends on income. After enabling the Analysis ToolPak (File > Options > Add-ins), follow these steps:
- Prepare your data with independent variable (Income) and dependent variable (Spending).
- Go to Data > Data Analysis > Regression.
- Select the input Y range (Spending) and input X range (Income).
- Choose output options and click OK.
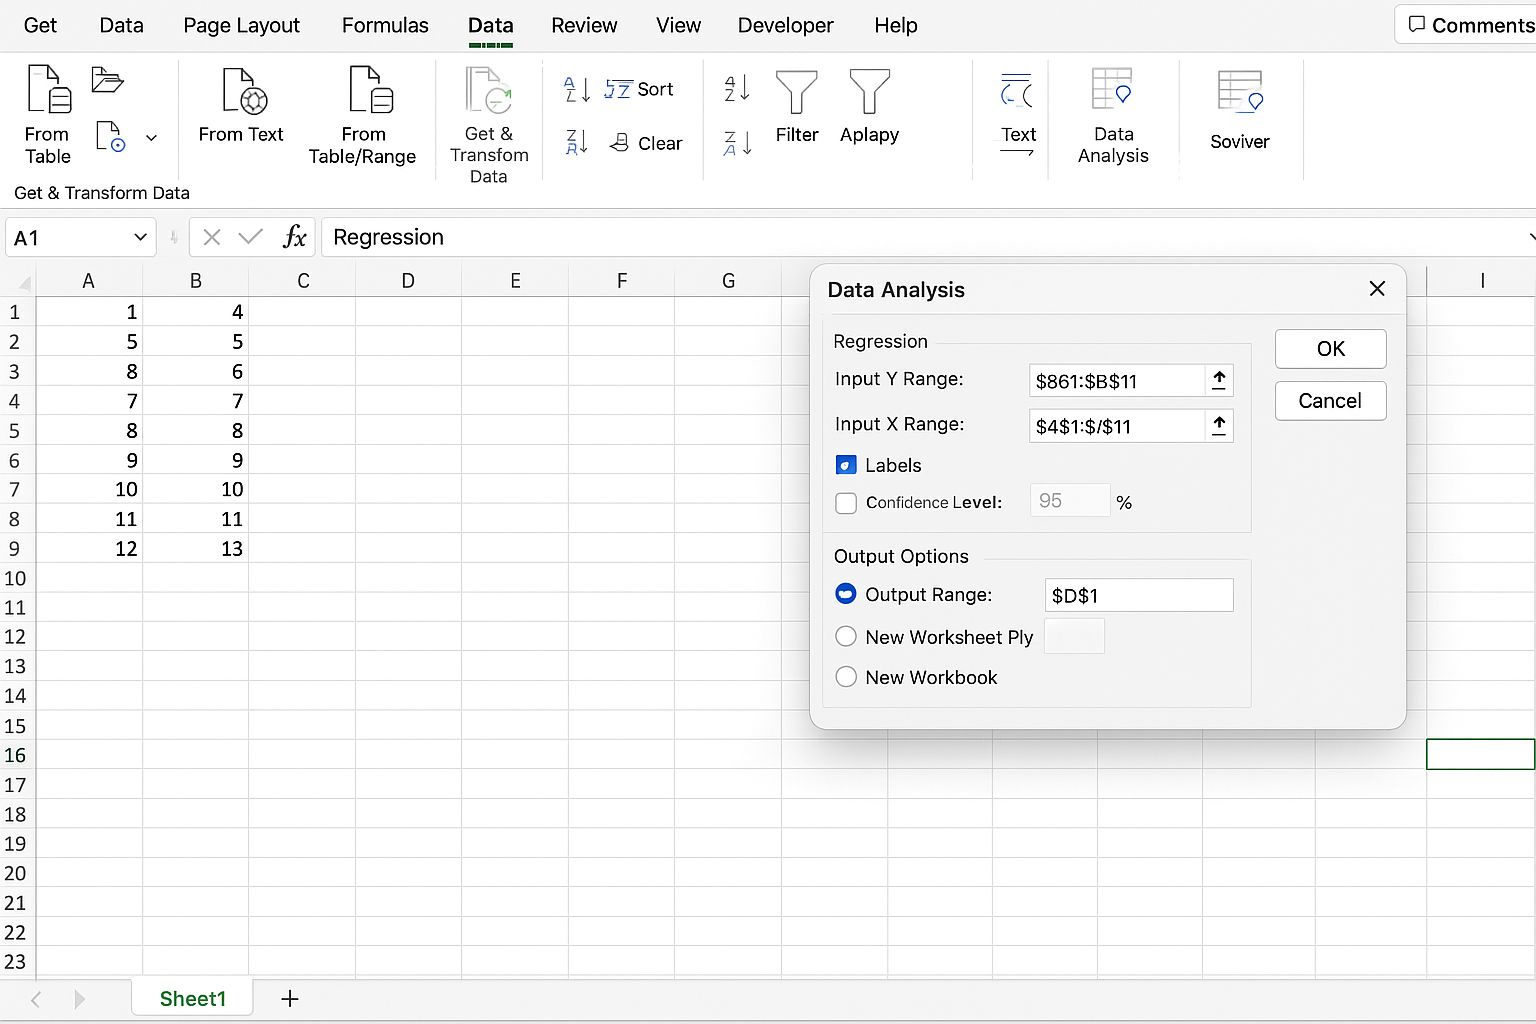
The output will provide coefficients, R-squared value, and significance levels, helping you interpret the economic relationship.
Practical Example: Analyzing Unemployment Data
Suppose you have a dataset with monthly unemployment rates by state. Here’s a basic workflow:
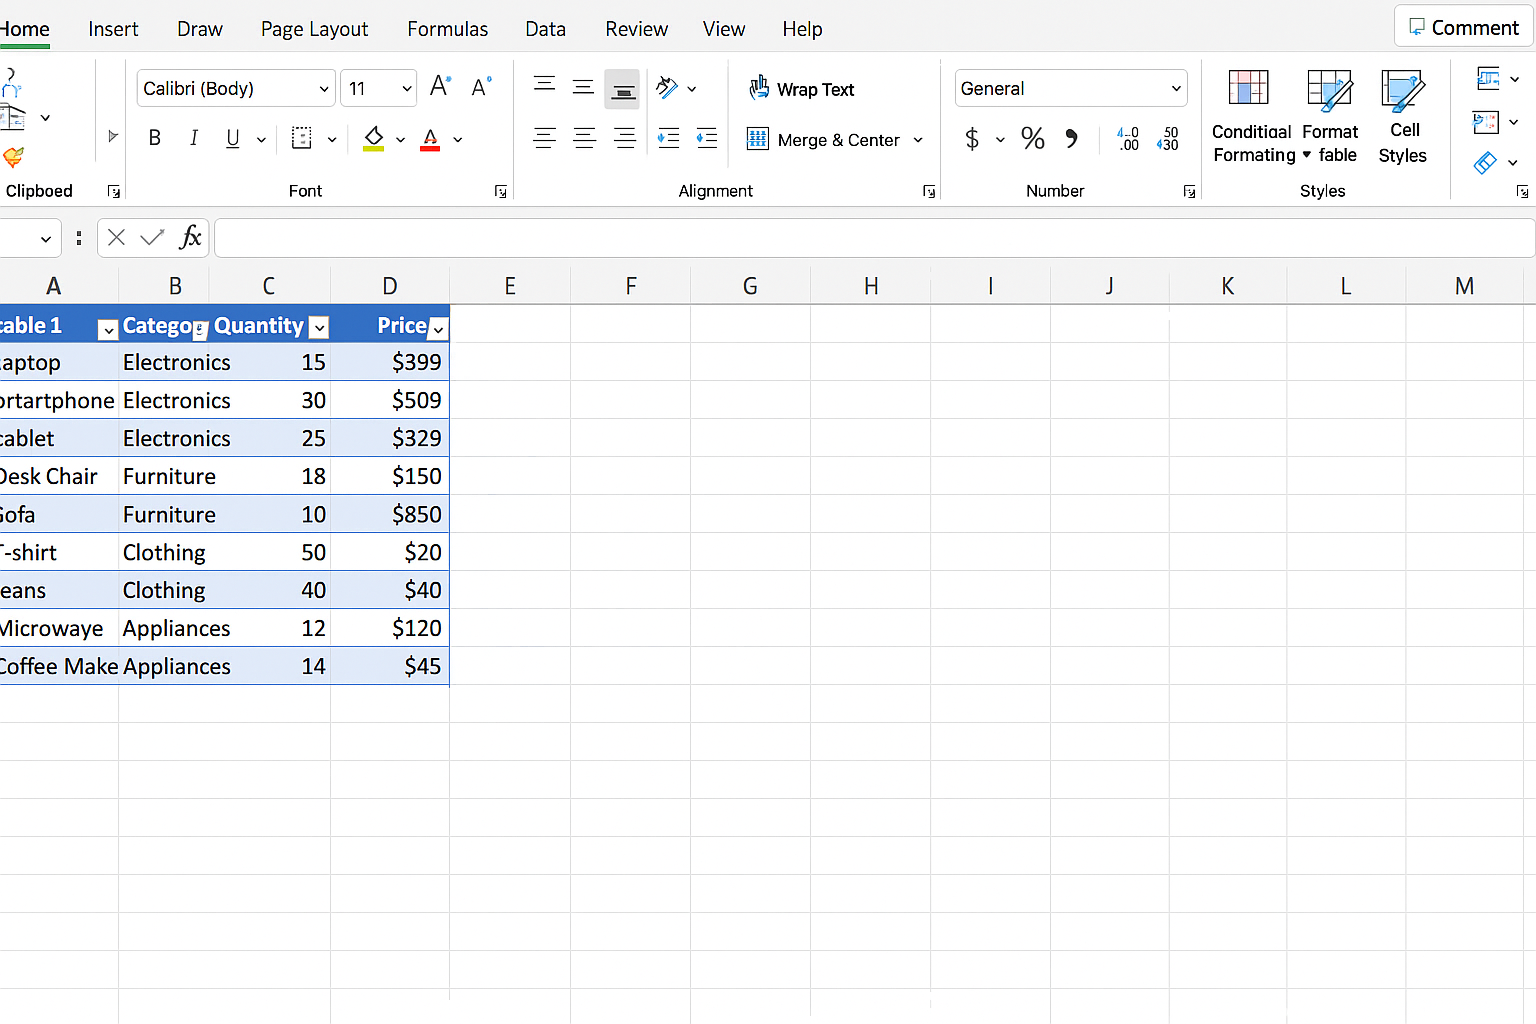
- Import Data: Copy or import your CSV file into Excel.
- Convert to Table: Press Ctrl + T for easy filtering.
- Calculate Average Unemployment Rate: Use
=AVERAGE(Table1[Unemployment Rate]). - Identify States with High Unemployment: Use
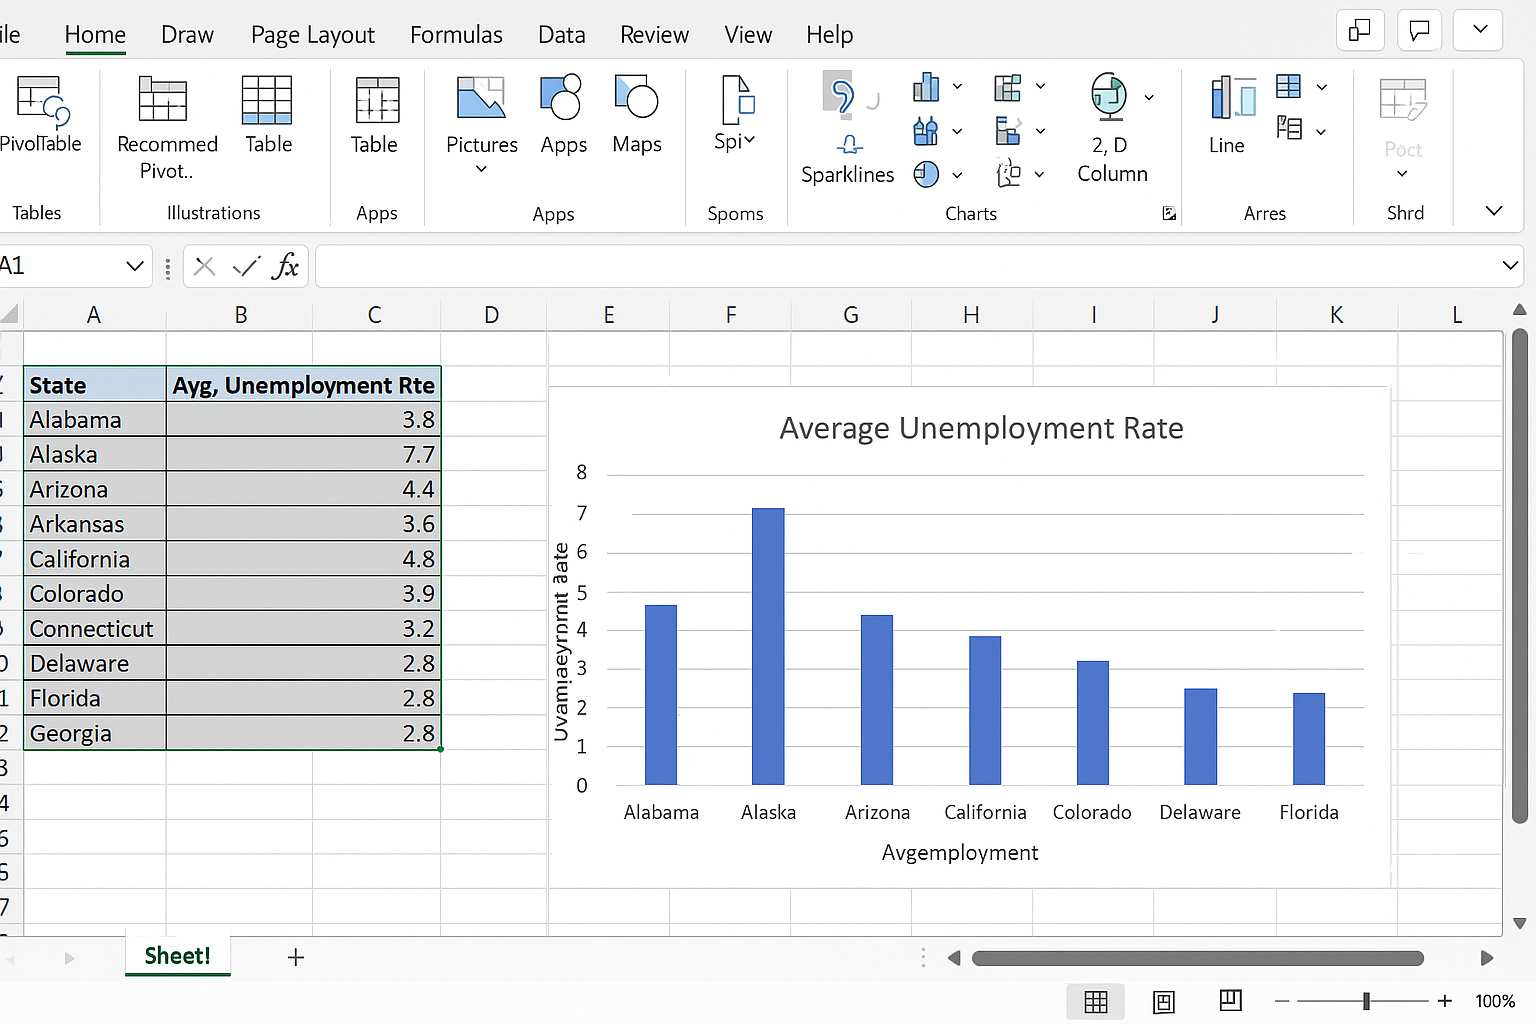
=IF([@Unemployment Rate]>7,"High","Normal")in a new column. - Create a Bar Chart: Highlight average unemployment rates by state and insert a bar chart to visualize disparities.
Tips for Efficient Excel Use
- Keyboard Shortcuts: Learn shortcuts like Ctrl + C/V for copy/paste, Ctrl + Z for undo, and Alt + = for AutoSum.
- Named Ranges: Define names for key data ranges to simplify formulas.
- Data Validation: Restrict input values to avoid errors, e.g., limit percentage entries between 0 and 100.
- Protect Sheets: Lock cells with formulas to prevent accidental changes.
Conclusion
Mastering Excel basics is crucial for economists to efficiently manage data, create economic models, and present insights. From organizing data tables to performing regression analysis, Excel serves as a versatile toolkit for economic research and decision-making. By learning and applying these foundational skills, economists can enhance their productivity and analytical capabilities.
Frequently Asked Questions
Related Articles
- Top 10 Excel Functions Useful for Economists
- Data Entry Tips in Excel for Economists to Save Time
- How Economists Can Use Excel for Effective Data Analysis
- Using Excel Pivot Tables to Analyze Economic Data
- Performing Regression Analysis in Excel for Economic Research
Want practical Excel help?
Support free Excel tutorials, get weekly tips, or contact us for Excel programming, VBA, Power Query, dashboards, and automation work.