Using Excel to Analyze Macroeconomic Indicators
Introduction
Macroeconomic indicators such as GDP, inflation rates, unemployment, and interest rates provide critical insights into the health of an economy. For economists and analysts, the ability to efficiently analyze this data is essential for forecasting and policy-making. Microsoft Excel remains one of the most accessible and powerful tools for macroeconomic data analysis due to its flexibility, computational power, and ease of use. This article explores how to use Excel to analyze macroeconomic indicators effectively, providing practical examples and tips to enhance your economic analysis skills.
Understanding Macroeconomic Data
Macroeconomic data is often published by government agencies, central banks, and international organizations. Common indicators include:
- Gross Domestic Product (GDP): Measures the total economic output of a country.
- Inflation Rate: The rate at which prices for goods and services rise.
- Unemployment Rate: The percentage of the labor force that is jobless.
- Interest Rates: The cost of borrowing money, often set by central banks.
These data sets typically come in time series format, which can be analyzed using Excel’s built-in functions and tools.
Importing Macroeconomic Data into Excel
The first step in macroeconomic data analysis in Excel is importing reliable data. Popular sources include the World Bank, Federal Reserve Economic Data (FRED), and International Monetary Fund (IMF).
To import data:
- Download data in CSV or Excel format from the source.
- Open the file directly in Excel or use
Data > Get & Transform Data > From Text/CSVto import. - Clean and format the data if necessary, ensuring dates and values are correct.
Using Excel Functions for Macroeconomic Analysis
Excel offers a wide range of functions ideal for analyzing macroeconomic data:
- Trend Analysis: Use
LINESTorSLOPEfunctions to identify trends in GDP or inflation over time. - Growth Rates: Calculate percentage changes using formulas like
=((NewValue - OldValue)/OldValue)*100. - Moving Averages: Smooth out fluctuations with the
AVERAGEfunction over defined time windows. - Correlation: Use
CORRELto examine relationships between variables, such as inflation and interest rates.
Practical Example: Analyzing GDP Growth and Inflation
Consider a dataset containing quarterly GDP and inflation data over five years. Here is how you can analyze it in Excel:
- Import the data into two columns: Date, GDP, and Inflation Rate.
- Calculate quarterly GDP growth rates:
=((B3-B2)/B2)*100where B2 and B3 are GDP values for consecutive quarters. - Create a moving average of inflation to filter out volatility:
=AVERAGE(C2:C5)for a 4-quarter moving average. - Plot GDP growth and inflation moving average on a line chart to visualize trends.
- Use the
CORRELfunction to check the correlation between GDP growth and inflation:=CORREL(D2:D21, E2:E21)where D and E are ranges for GDP growth and inflation moving average.
Advanced Tools: Pivot Tables and Data Analysis Toolpak
For deeper insights, Excel’s Pivot Tables allow you to summarize and explore large datasets quickly. You can aggregate data by year, region, or economic sector to identify patterns.
The Data Analysis Toolpak is another powerful add-in that provides statistical analysis such as regression, descriptive statistics, and histograms. To enable it:
- Go to
File > Options > Add-ins. - Select
Excel Add-insand clickGo. - Check
Analysis Toolpakand clickOK.
This add-in is particularly useful for running regression analysis to understand how various macroeconomic indicators interact.
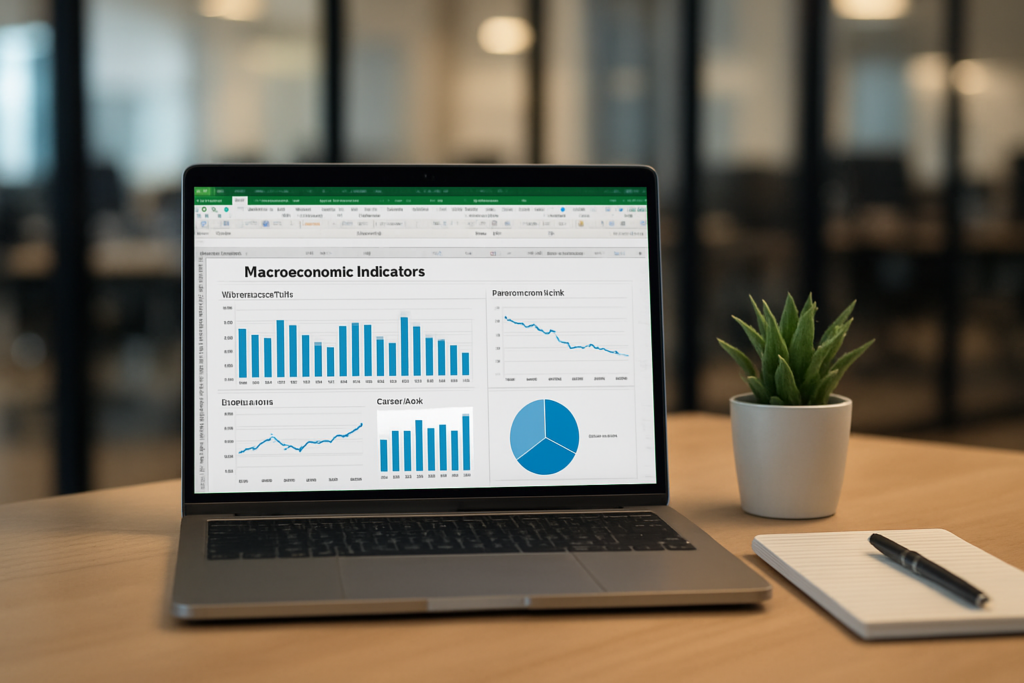
Visualizing Macroeconomic Data in Excel
Charts are essential for communicating findings clearly. Excel offers multiple chart types suited for macroeconomic data:
- Line charts: Track trends in indicators over time.
- Bar charts: Compare values across categories like countries or years.
- Scatter plots: Analyze correlations between two variables.
- Combo charts: Overlay different chart types, such as line and column, for comparative analysis.
Use chart elements like trendlines, labels, and data markers to enhance readability.
Tips for Effective Macroeconomic Data Analysis in Excel
- Maintain Clean Data: Ensure dates are consistent and numeric data is formatted correctly.
- Use Named Ranges: Simplify formulas by naming data ranges.
- Document Your Work: Use comments and separate sheets to track steps.
- Automate with Macros: For repetitive tasks, macros can save time by automating data cleaning and analysis.
Conclusion
Excel is a versatile and powerful tool for macroeconomic data analysis. By importing reliable data, applying essential functions, visualizing trends, and leveraging advanced tools like Pivot Tables and the Data Analysis Toolpak, economists can gain valuable insights into economic conditions. Mastering these Excel techniques empowers users to make informed forecasts, policy recommendations, and strategic decisions based on macroeconomic indicators.
Related Articles
- Excel Basics Every Economist Should Know
- Top 10 Excel Functions Useful for Economists
- Data Entry Tips in Excel for Economists to Save Time
- How Economists Can Use Excel for Effective Data Analysis
- Using Excel Pivot Tables to Analyze Economic Data
Want practical Excel help?
Support free Excel tutorials, get weekly tips, or contact us for Excel programming, VBA, Power Query, dashboards, and automation work.