Automate Excel Reporting with Power Query: A Practical Guide
Introduction
In today’s fast-paced business environment, automating repetitive tasks is essential to save time and reduce errors. Excel Power Query automation is a powerful tool that enables users to automate data extraction, transformation, and loading (ETL) processes in Excel. This practical guide will walk you through the fundamentals of Power Query and demonstrate how to automate Excel reporting to streamline your workflows and increase productivity.
What is Power Query?
Power Query is a data connection technology that enables you to discover, connect, combine, and refine data sources to meet your analysis needs. It is integrated into Excel and provides a user-friendly interface for importing and transforming data without requiring complex formulas or coding. Power Query supports automation by allowing you to create queries that refresh data automatically when the source data changes.
Benefits of Excel Power Query Automation
- Time Savings: Automate repetitive data preparation tasks to focus on analysis rather than manual work.
- Consistency: Ensure data transformation processes are standardized and error-free.
- Dynamic Reporting: Reports update automatically when source data changes.
- Integration: Connect data from multiple sources including Excel files, databases, web pages, and more.
Getting Started with Power Query Automation
To automate Excel reporting with Power Query, you need to first import your data into the Power Query Editor. Here’s a step-by-step example to get started:
Example 1: Importing and Transforming Sales Data
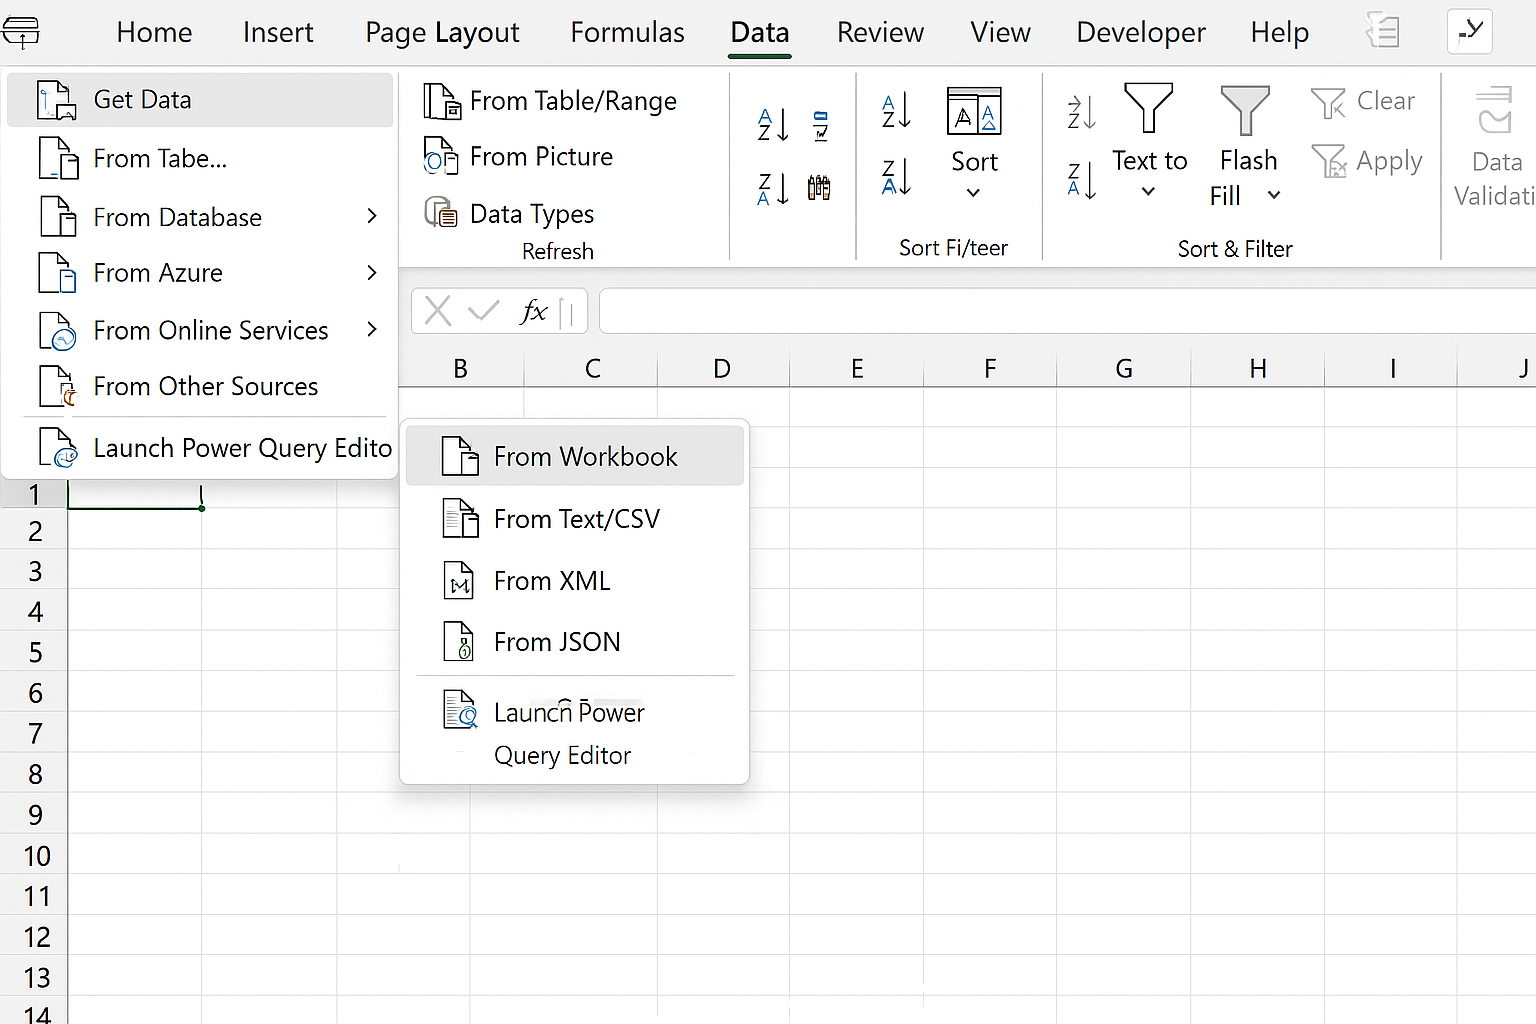
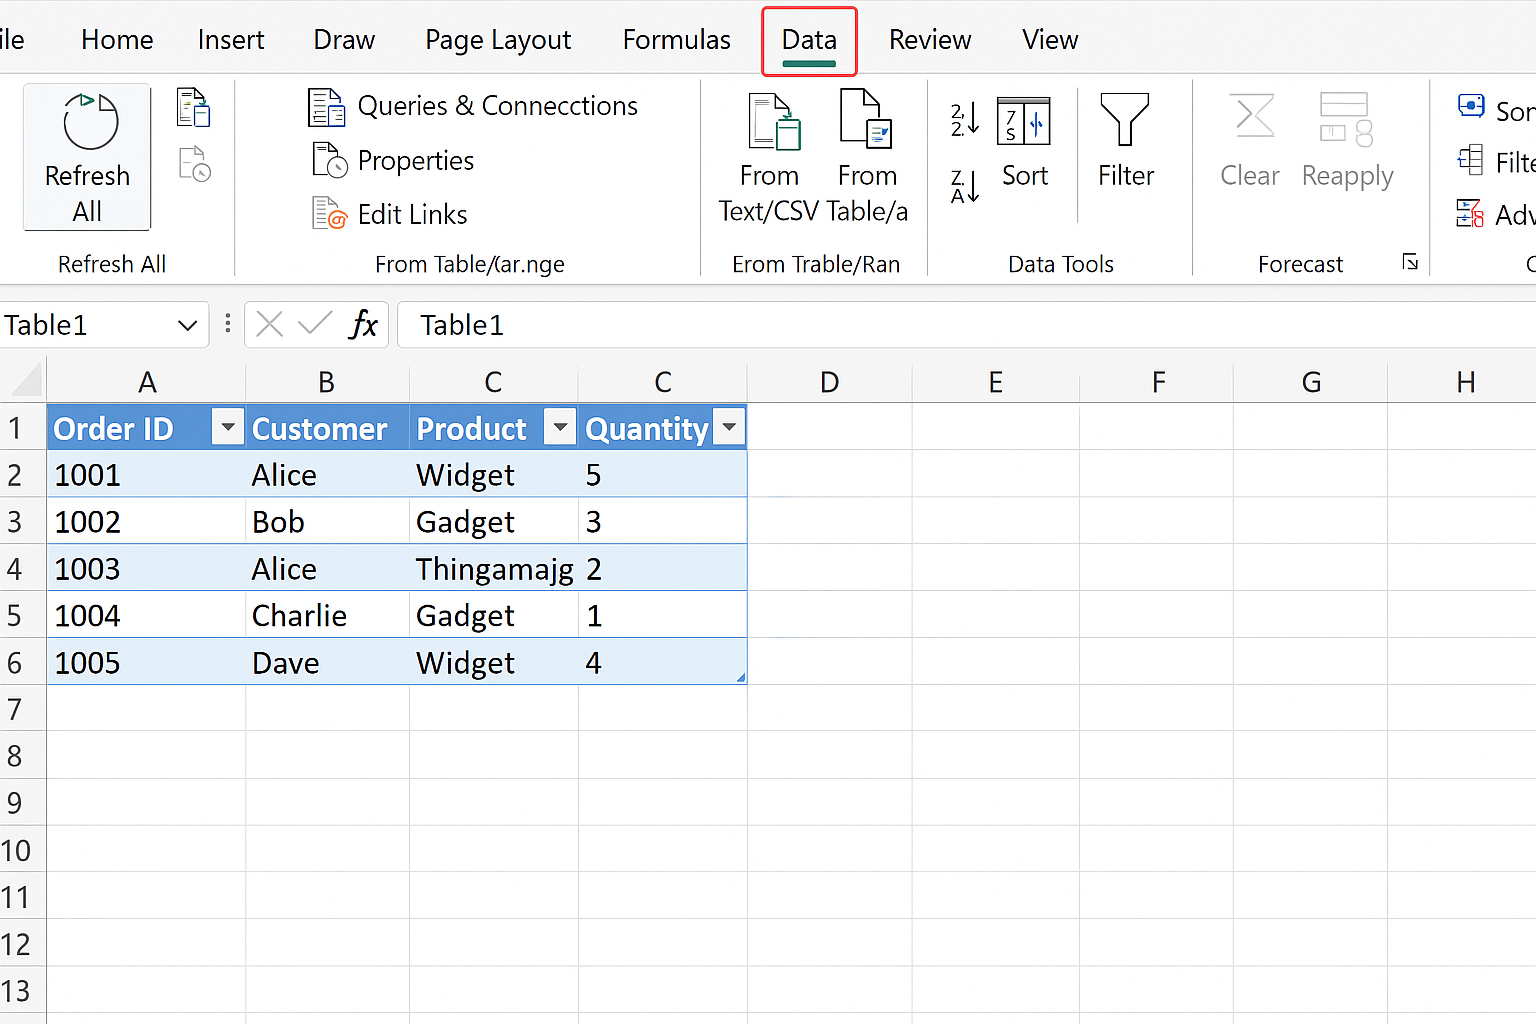
- Open Excel: Go to the Data tab and select Get Data > From File > From Workbook to import an Excel file containing sales data.
- Select the file: Choose your sales data Excel file and click Import.
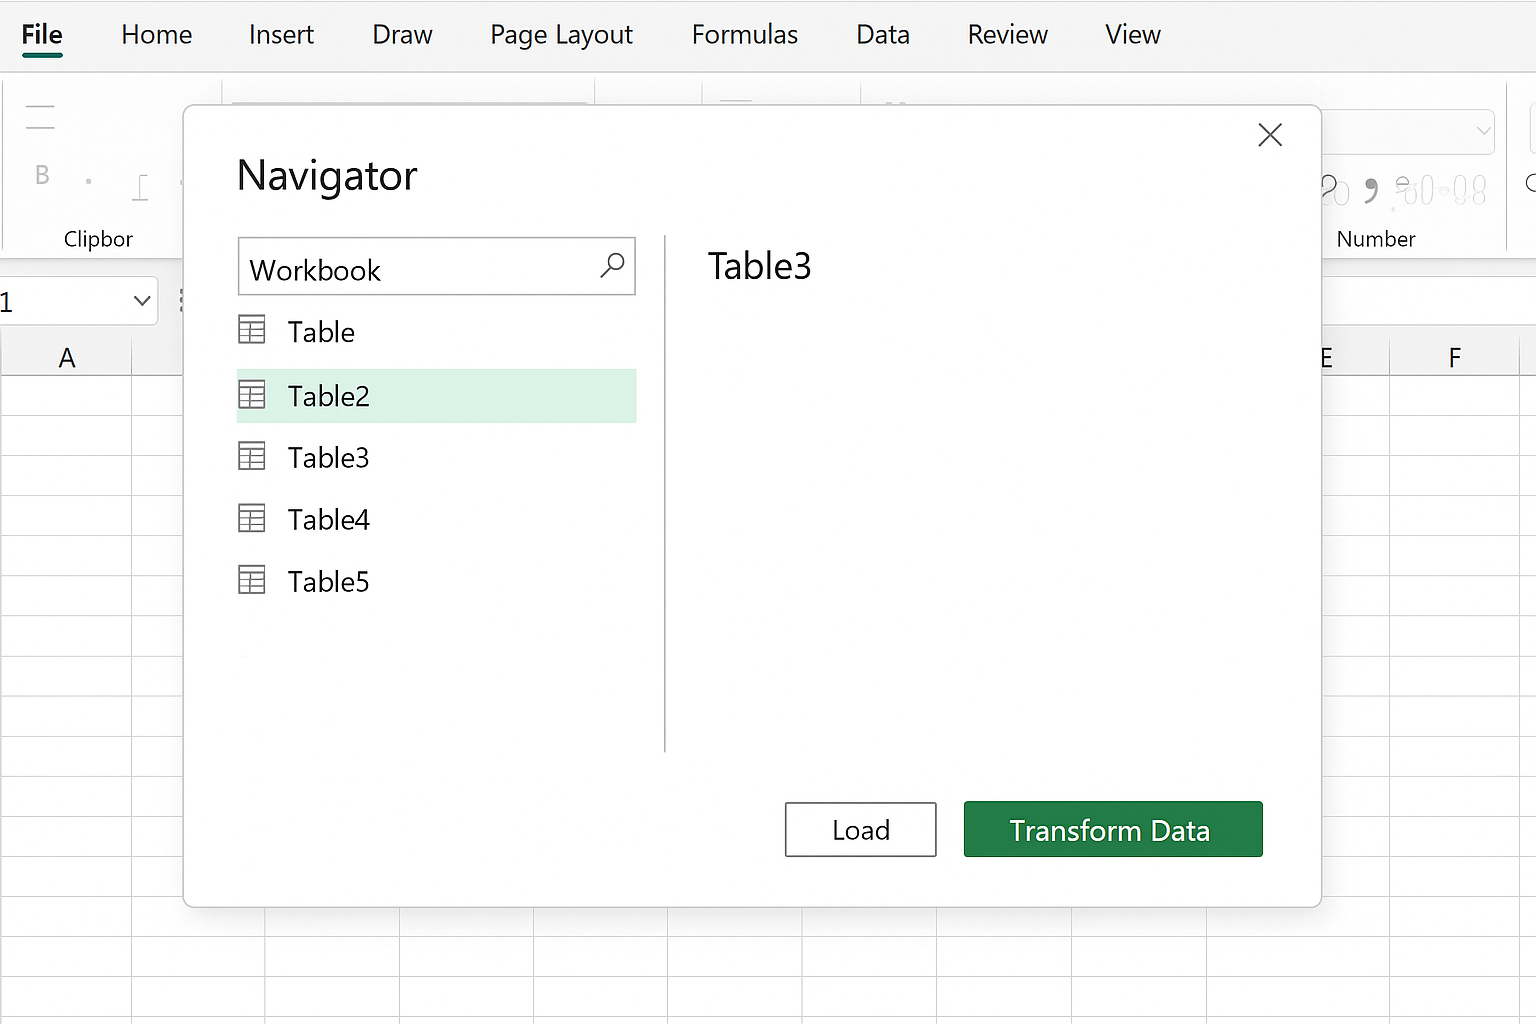
- Load Data into Power Query Editor: The Navigator window shows available tables. Select the desired table and click Transform Data.
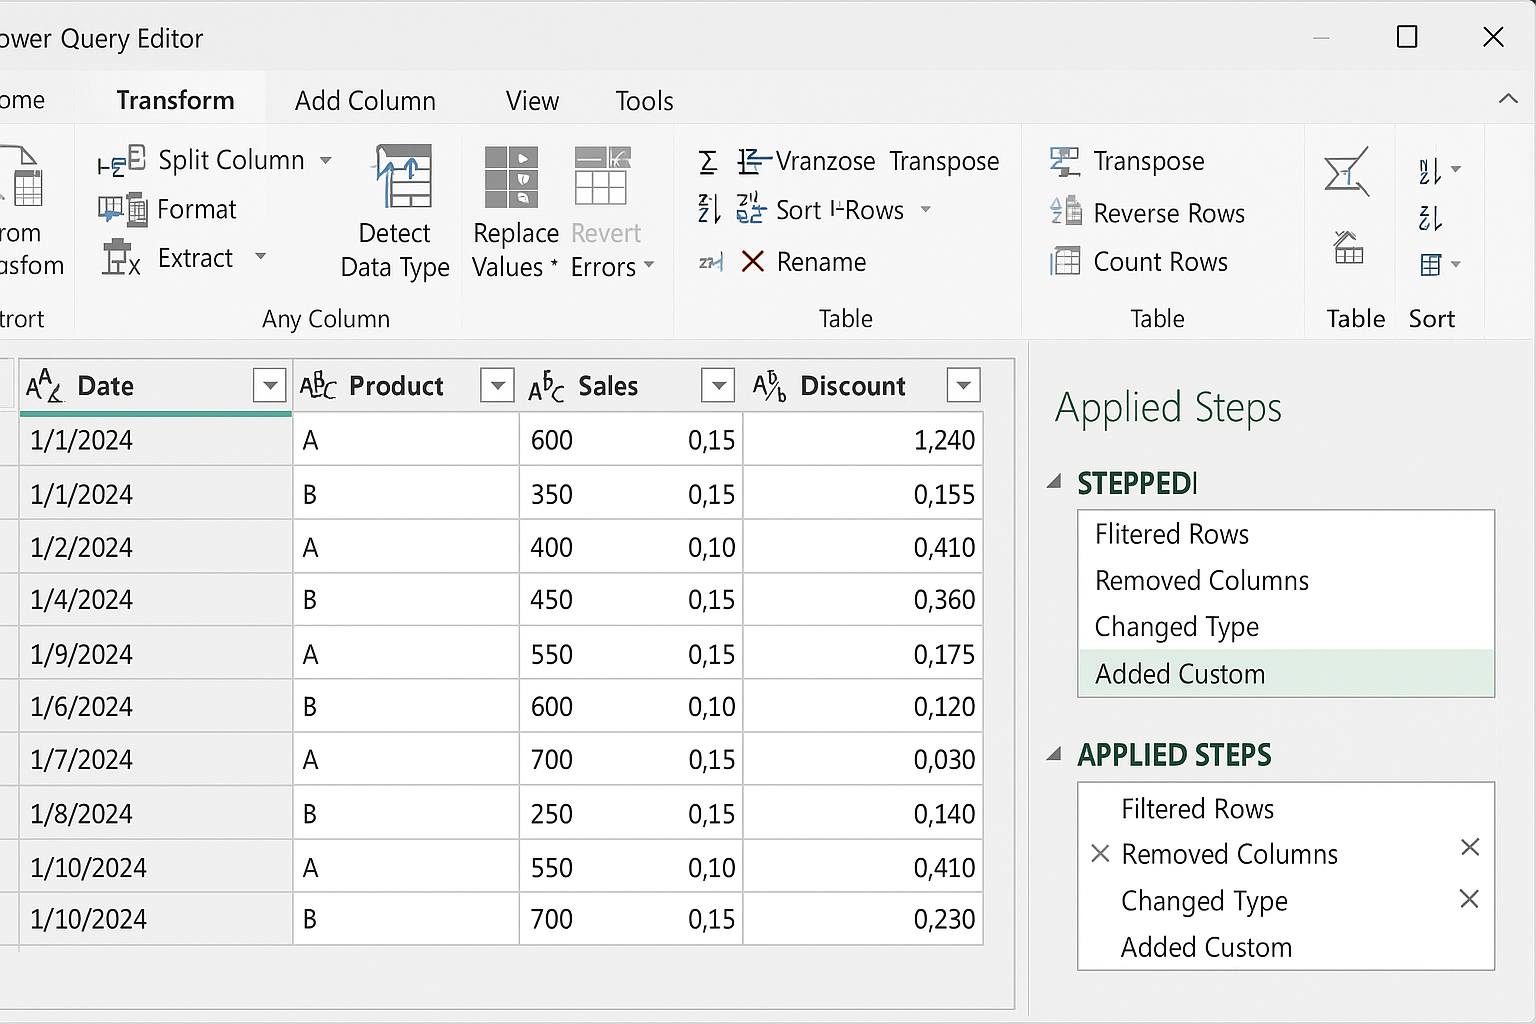
- Clean and transform data: Use Power Query features such as filtering rows, removing columns, changing data types, and adding calculated columns.
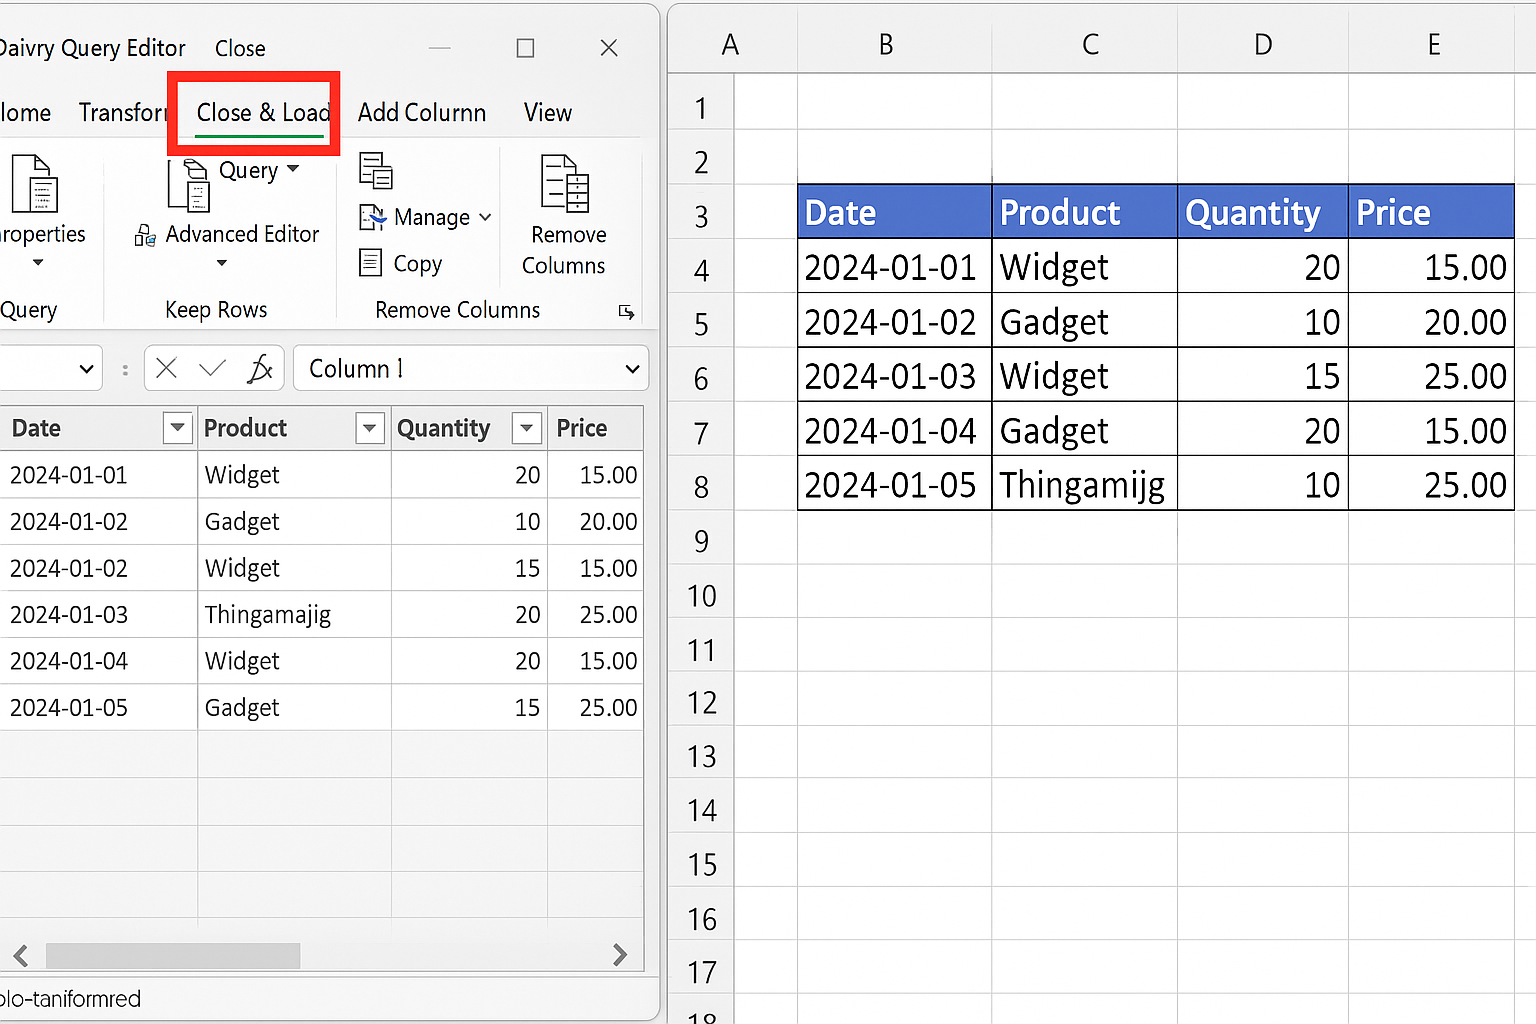
- Load to Excel: Once the data is prepared, click Close & Load to load the data into an Excel worksheet or data model.
With these steps, you have created a query that can be refreshed anytime to update your report automatically.
Automate Data Cleaning and Transformation
Power Query allows you to automate complex data cleaning and transformation tasks without writing VBA code. Here are some common examples:
- Remove Duplicates: Use the Remove Duplicates option to clean your dataset.
- Filter Rows: Automatically filter to include only data from a specific region or timeframe.
- Split Columns: Split full names into first and last names using delimiters.
- Pivot and Unpivot: Transform data structure for reporting needs.
- Merge Queries: Combine data from multiple tables or files.
Each transformation step is recorded and can be refreshed automatically when data changes.
Example 2: Automate Monthly Sales Report
Imagine you receive a monthly sales report in CSV format. Instead of manually importing and cleaning it each month, you can automate this process:
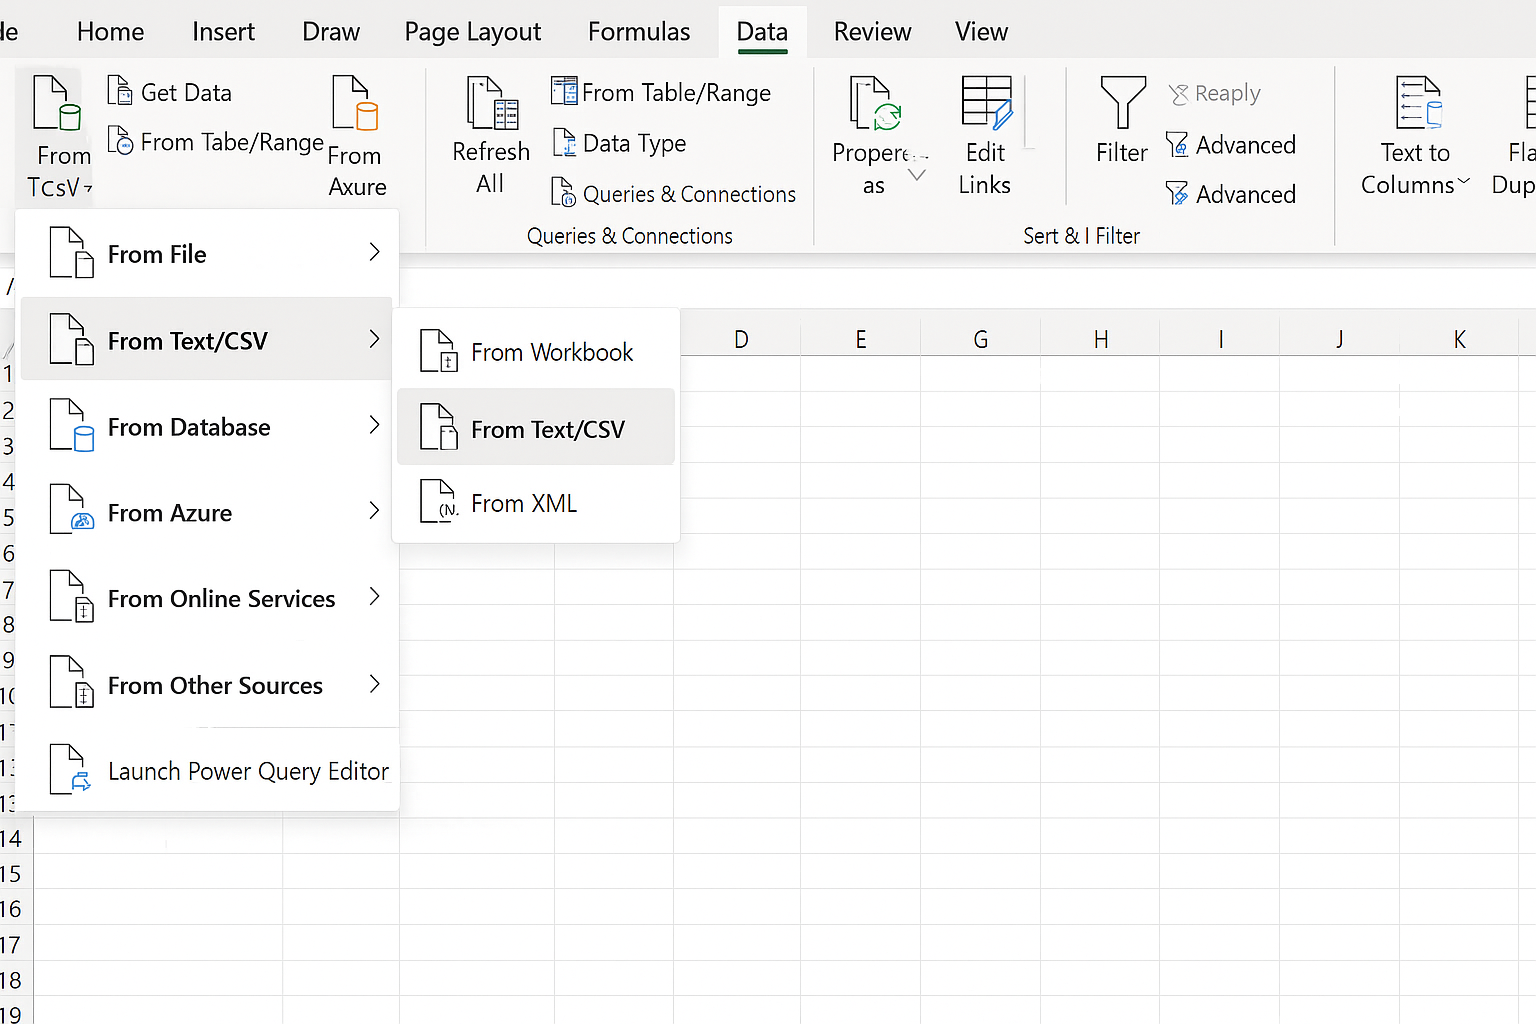
- Create a query to import the CSV file: Use Get Data > From Text/CSV.
- Apply transformations: Filter out irrelevant rows, change data types, calculate totals or commissions.
- Load transformed data into Excel: Use Close & Load to generate your report.
- Refresh the query: When a new CSV file is placed in the same location with the same name, simply click Refresh in Excel to update the report automatically.
This process saves hours of manual work every month and ensures your reports are always up to date.
Tips for Effective Excel Power Query Automation
- Standardize Data Sources: Keep source files consistent in structure and naming.
- Use Parameters: Create query parameters to make your queries dynamic and reusable.
- Document Your Queries: Use descriptive step names and comments to make maintenance easier.
- Combine with PivotTables: Use Power Query output as a source for PivotTables for interactive reporting.
- Schedule Refreshes: If using Excel with Power BI or other tools, schedule automatic refreshes for real-time data updates.
Common Challenges and How to Overcome Them
While Power Query is powerful, you may face some challenges:
- Changing Source Structure: If the layout of source files changes, queries may break. Maintain consistency or update queries accordingly.
- Large Data Sets: Performance can slow with very large datasets. Filter data early and optimize steps.
- Learning Curve: Understanding Power Query M language can help build advanced queries.
Conclusion
Excel Power Query automation is an essential skill for anyone looking to improve efficiency and accuracy in data reporting. By automating data import, cleaning, and transformation, you save valuable time and reduce errors. With practical examples and tips provided in this guide, you are now equipped to create dynamic, automated Excel reports that refresh with a single click. Start exploring Power Query today and transform your Excel reporting workflows.
Related Articles
- Power Query Tutorial: Getting Started with Data Transformation
- Understanding the Power Query Interface: A Beginner’s Guide
- How to Use Power Query in Excel for Efficient Data Cleaning
- Top 10 Excel Power Query Tips to Boost Your Data Analysis
- Mastering Data Transformation with Power Query: Step-by-Step Guide
Want practical Excel help?
Support free Excel tutorials, get weekly tips, or contact us for Excel programming, VBA, Power Query, dashboards, and automation work.