Understanding the Power Query Interface: A Beginner’s Guide
Introduction
Power Query is a powerful data transformation and connection tool available in Excel that allows users to import, cleanse, and reshape data with ease. For beginners, understanding the Power Query interface is essential to unlock its full potential. This guide covers the core elements of the Power Query interface, practical examples, and tips to get started quickly.
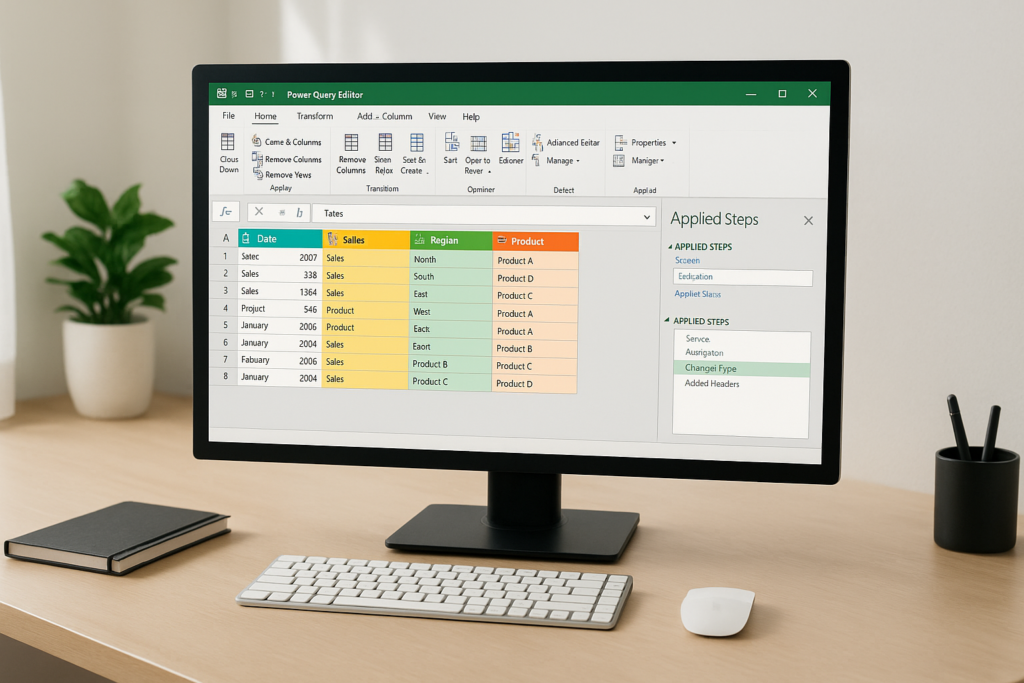
The Power Query Interface Overview
The Power Query interface is designed to be intuitive, providing users with the necessary tools and options to manipulate data effectively. It primarily consists of the following components:
- Ribbon: Contains tabs and buttons for various actions and transformations.
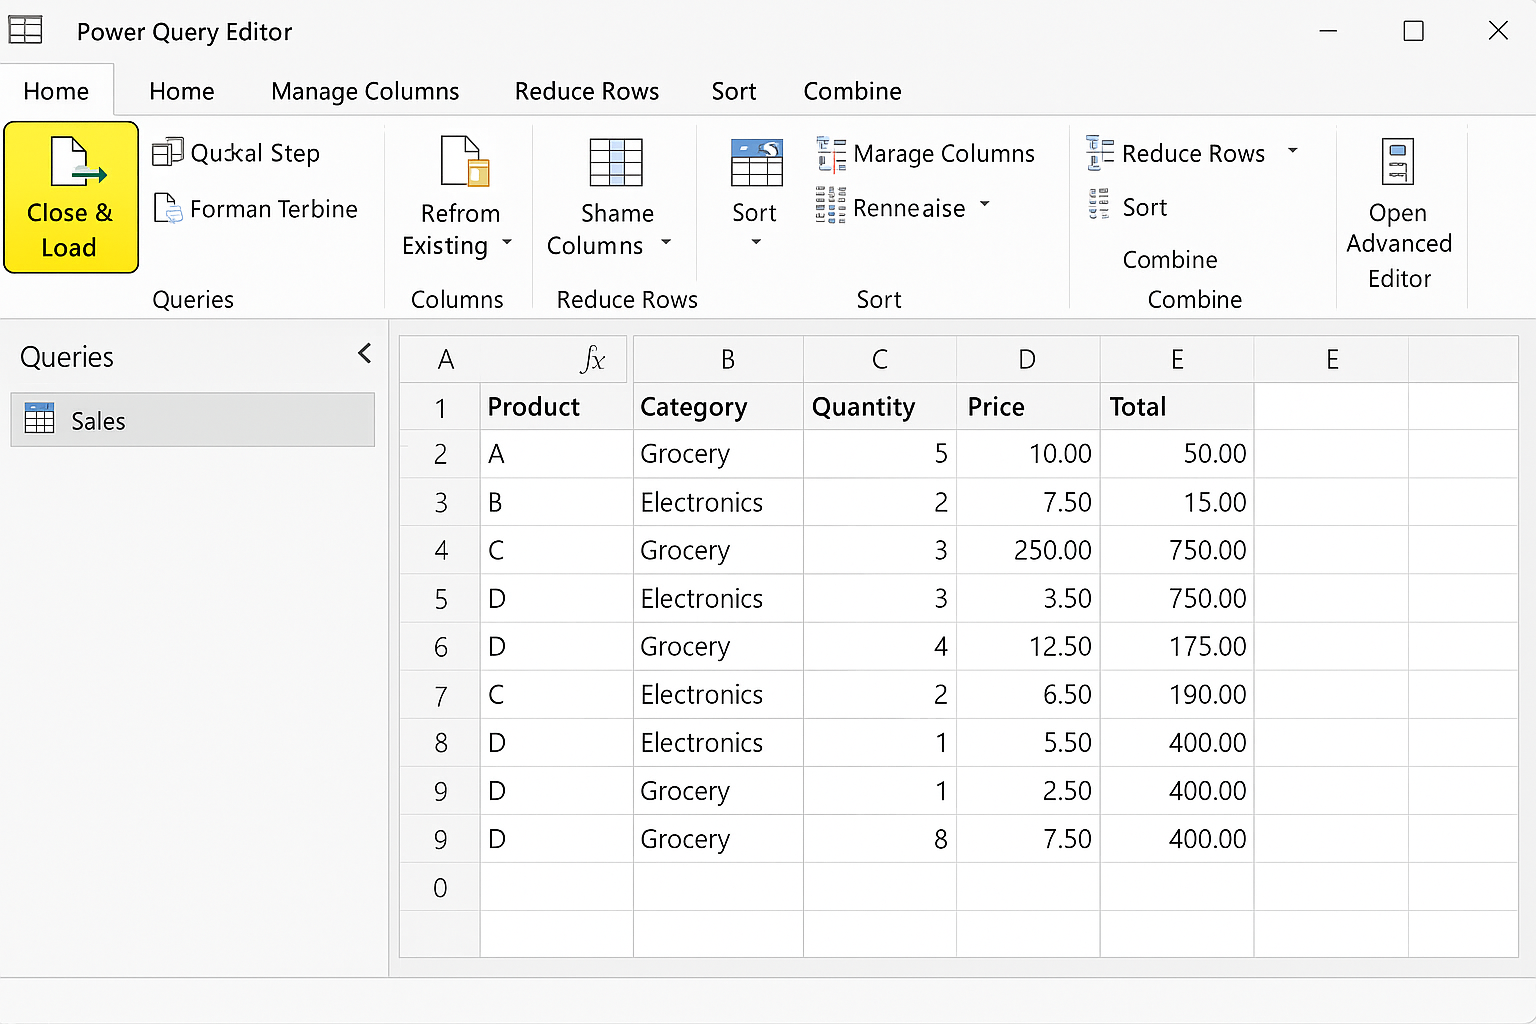
- Queries Pane: Displays all queries in the current workbook.
- Data Preview: Shows a snapshot of the data after each transformation.
- Applied Steps: Lists all transformation steps applied to the data.
- Formula Bar: Shows the M code for the current step and allows manual editing.
Exploring the Ribbon
The Ribbon in Power Query is divided into several tabs, each containing groups of commands:
- Home Tab: Import data, manage queries, and apply common transformations like removing columns, sorting, or filtering.
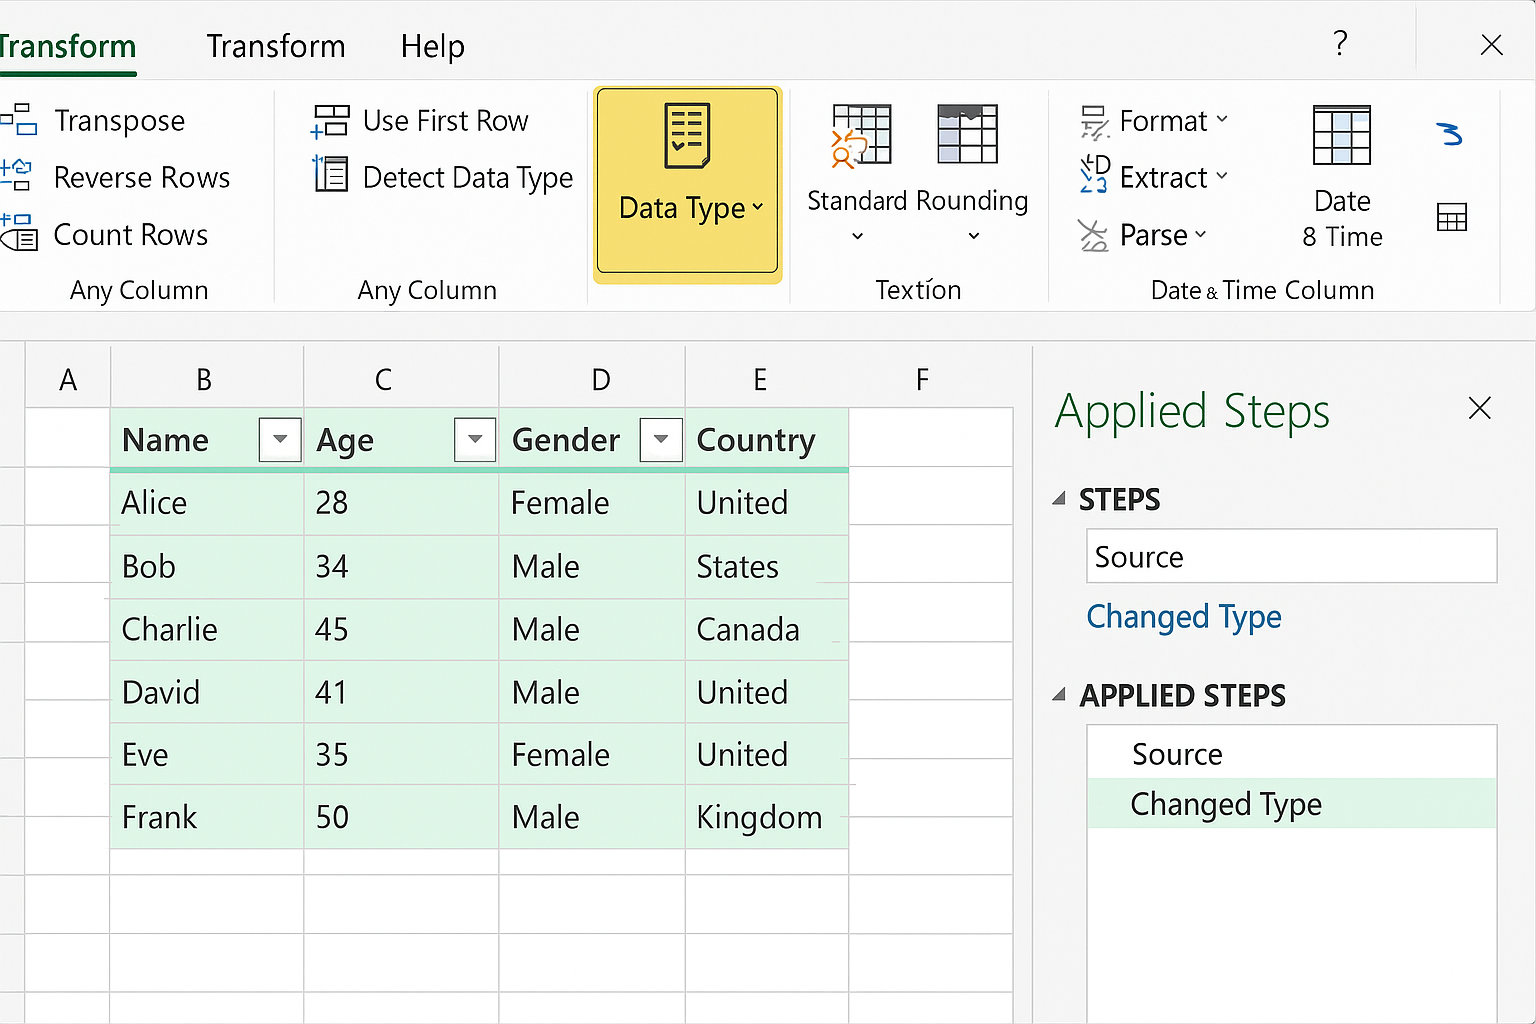
- Transform Tab: Perform data transformation actions such as pivoting, unpivoting, splitting columns, and changing data types.
- Add Column Tab: Create new columns based on calculations, conditional logic, or transformations.
- View Tab: Adjust the interface settings, view query dependencies, or enable/disable the formula bar.
Practical Example: Importing and Cleaning Data
Let’s walk through a simple example demonstrating how the Power Query interface helps in importing and cleaning data.
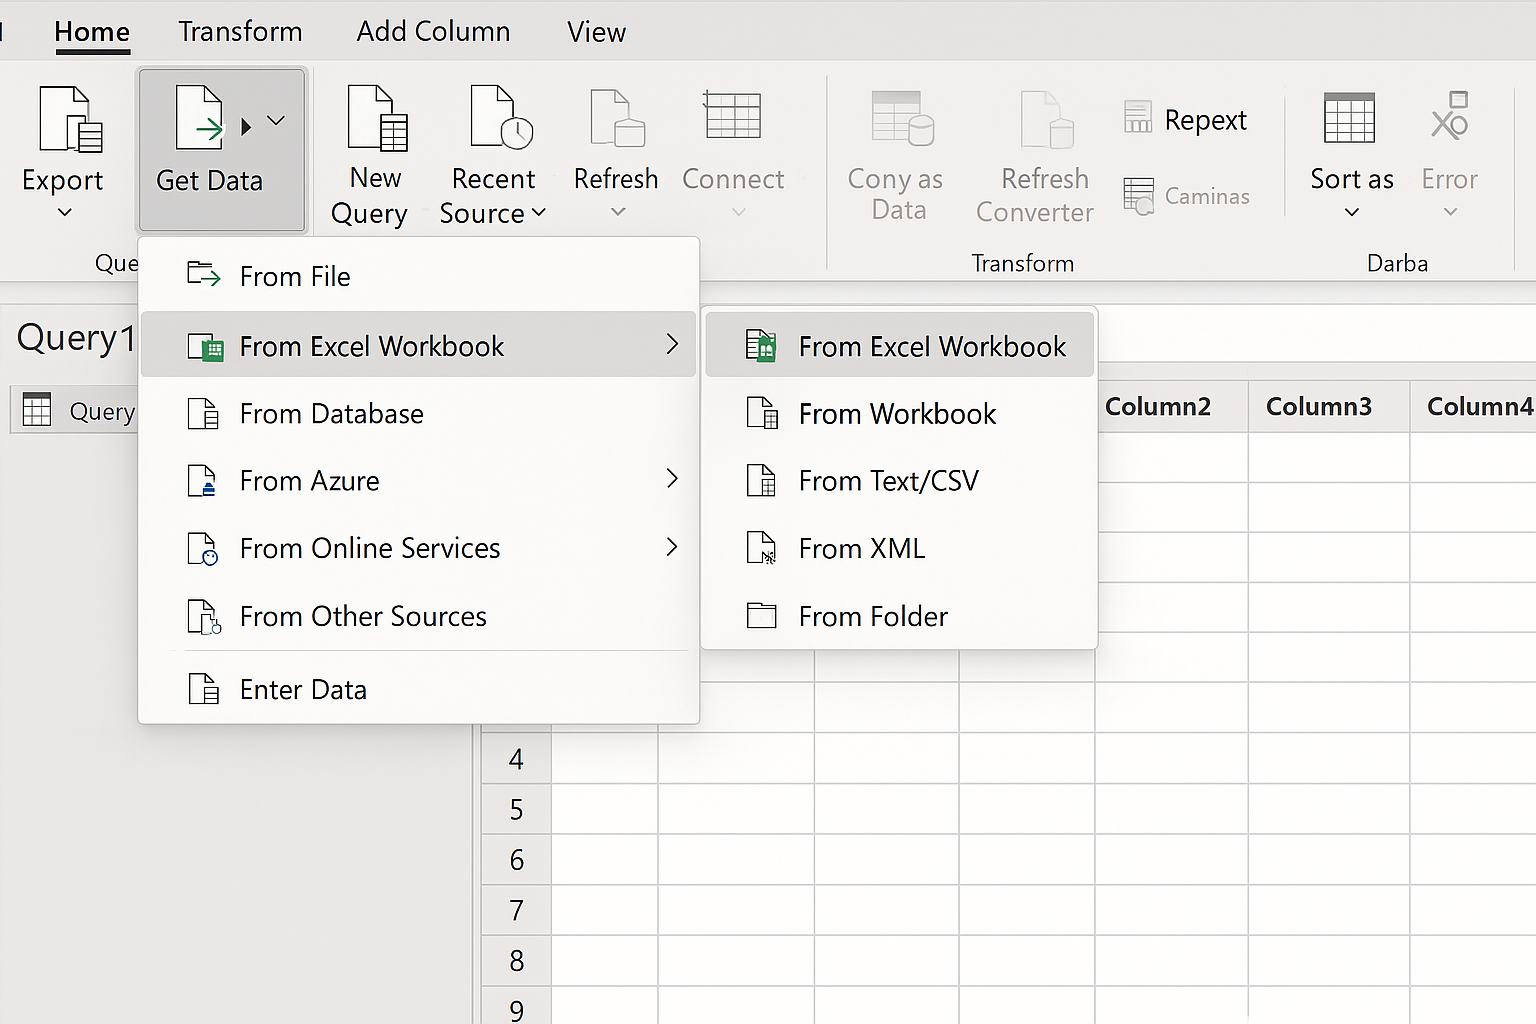
- Import Data: In the Home tab, click Get Data > From File > From Excel Workbook to import data from an Excel file.
- Data Preview: Once the file is selected, the data preview pane shows the imported data.
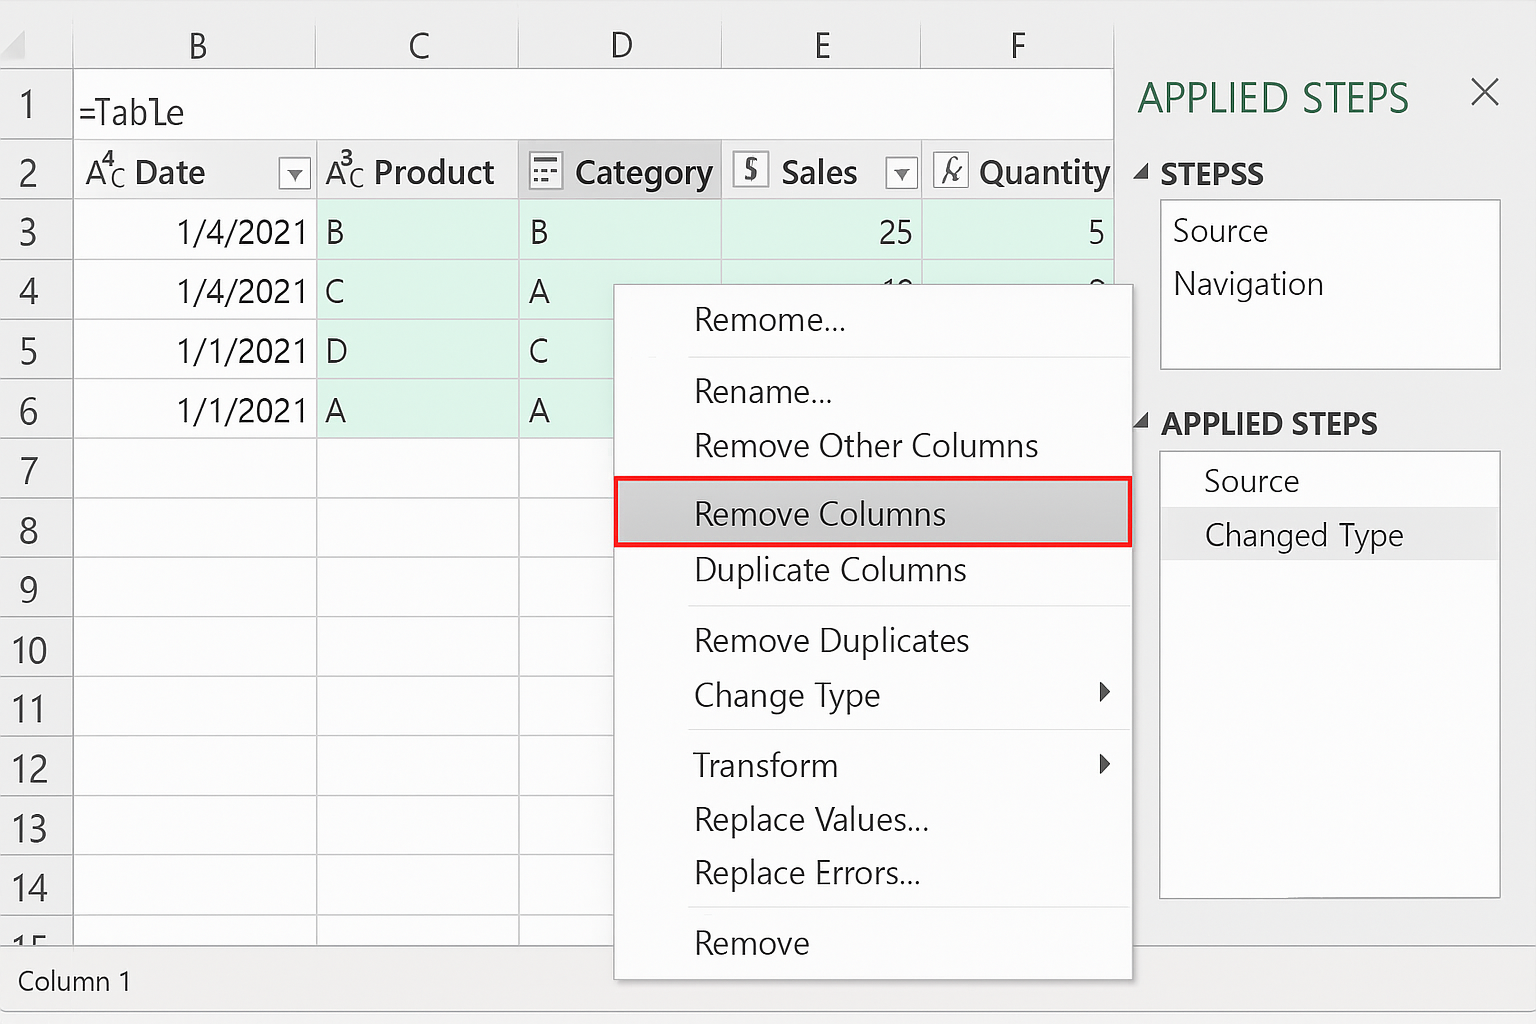
- Remove Unnecessary Columns: Select columns you don’t need, right-click and choose Remove Columns.
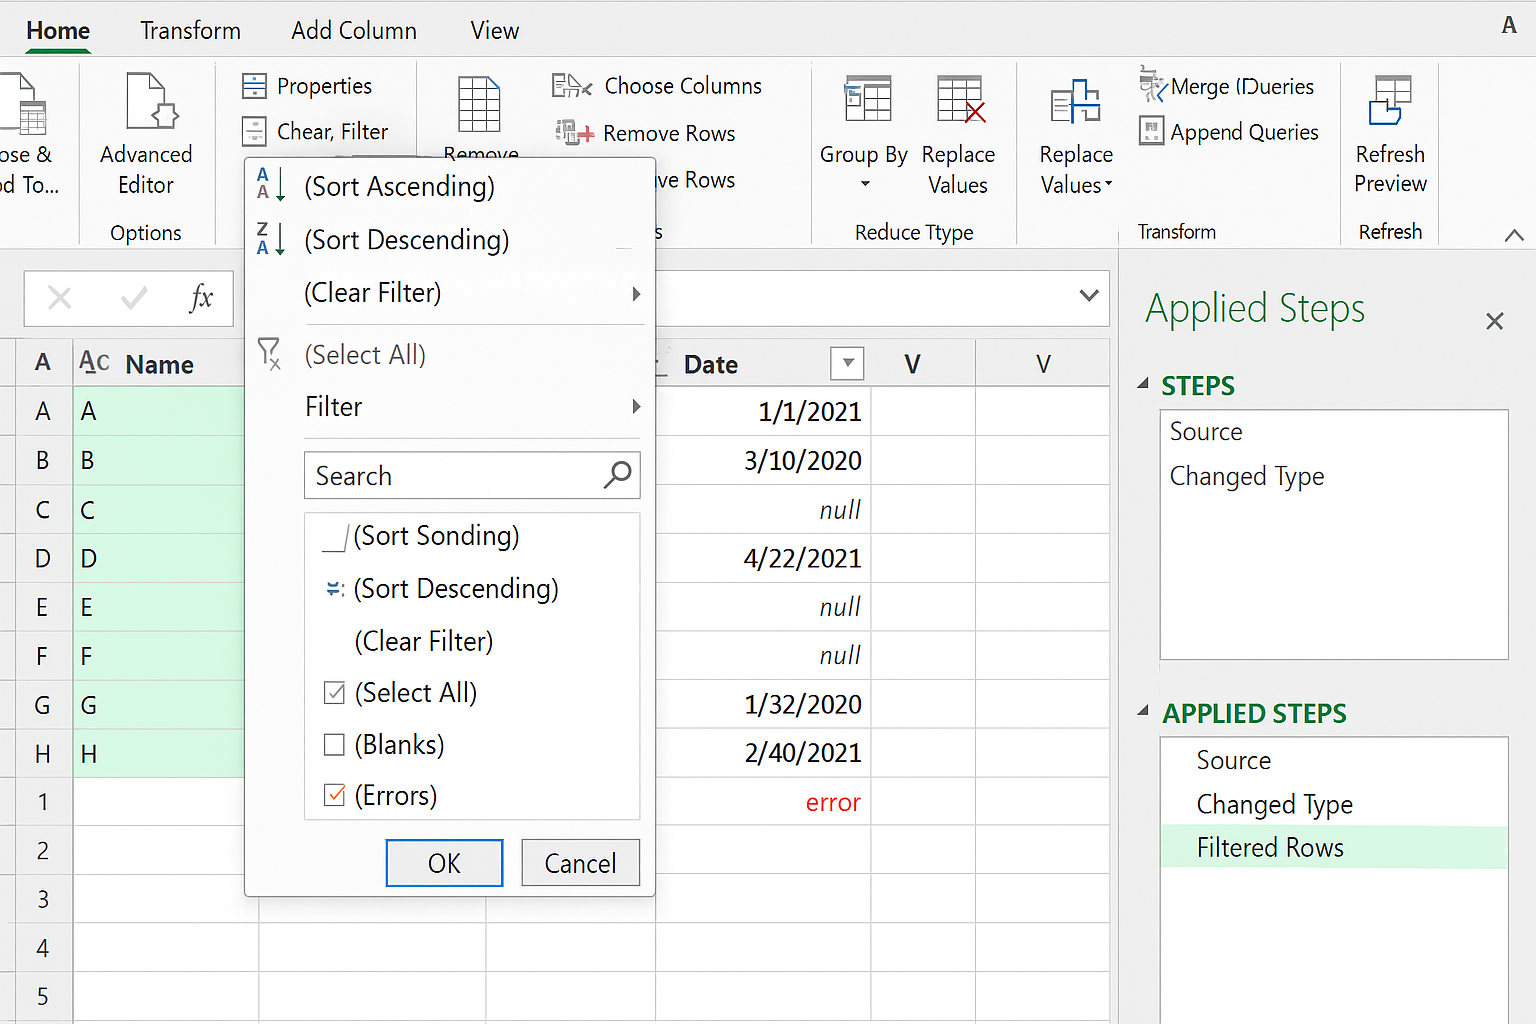
- Filter Rows: Use the dropdown filter on columns to exclude unwanted data, such as blank or error values.
- Change Data Types: Select columns and use the Data Type button in the Transform tab to set appropriate data types.
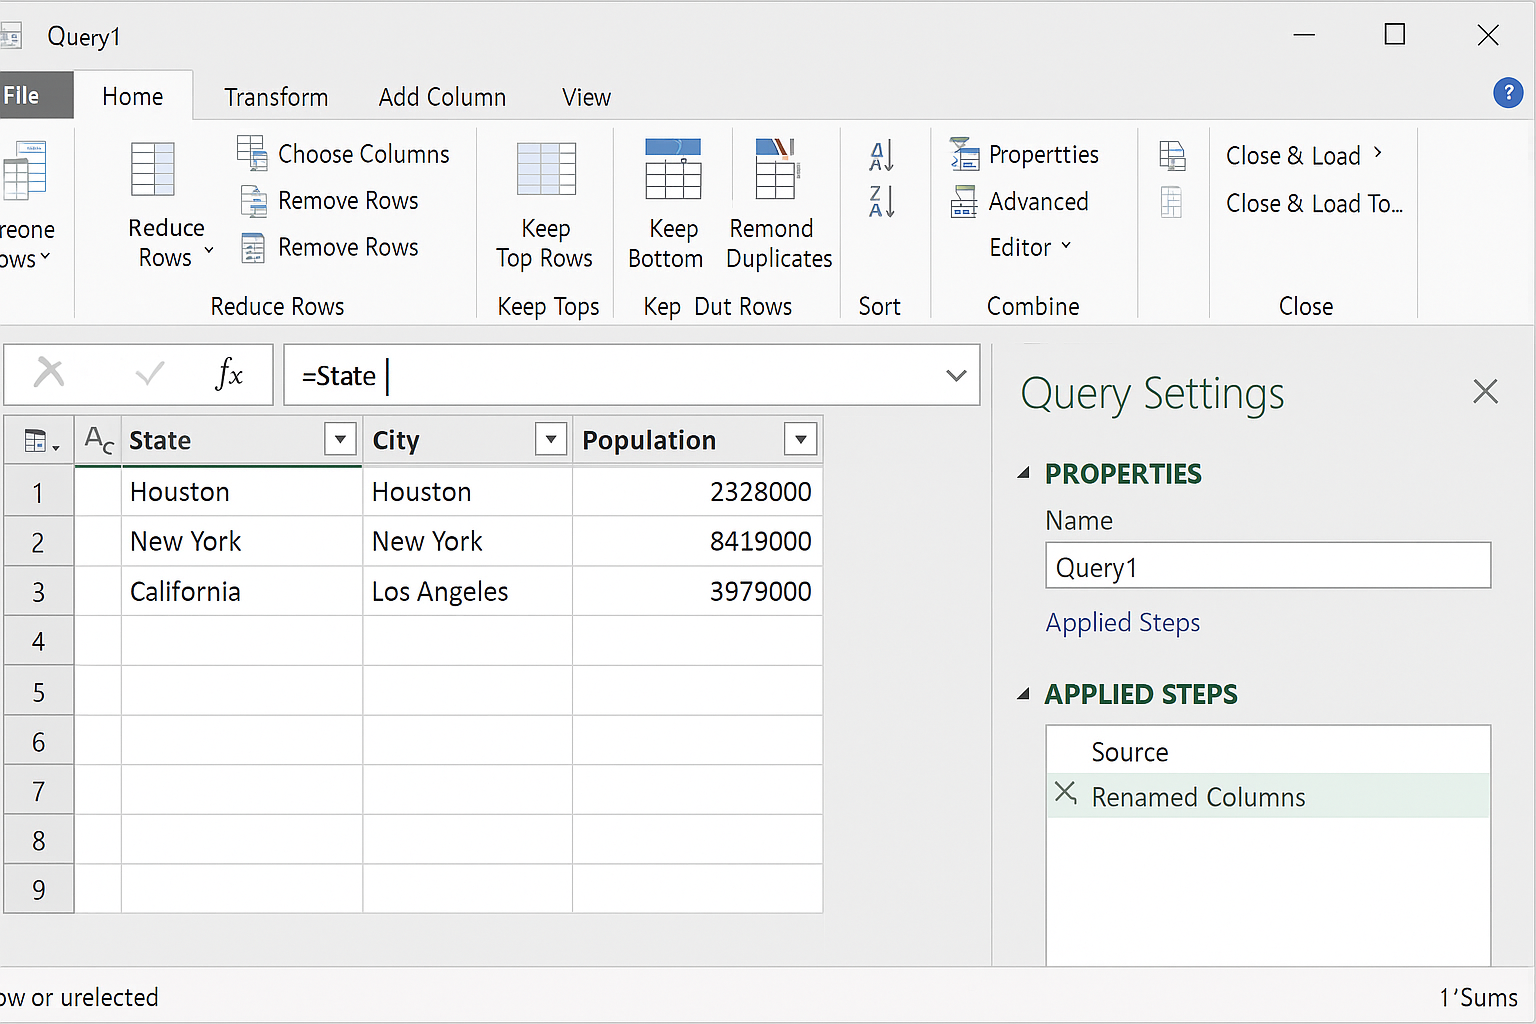
- Rename Columns: Double-click any column header to rename it for clarity.
- Applied Steps: Notice how each action adds a step in the Applied Steps pane, allowing you to track and modify transformations.
- Load Data: Click Close & Load in the Home tab to load the transformed data back into Excel.
Understanding the Applied Steps Pane
The Applied Steps pane is critical in Power Query. It records every action you take, from importing data to transformations. Each step can be reviewed, renamed, reordered, or deleted:
- Review: Click any step to see the data state at that point.
- Edit: Double-click a step name to rename it for better understanding.
- Reorder: Drag steps up or down to change the sequence, although some steps depend on others.
- Delete: Remove unnecessary steps to clean your query.
Using the Formula Bar
The Formula Bar displays the M code behind each applied step, giving advanced users the ability to fine-tune or write custom transformations. To enable it, go to the View tab and check the Formula Bar option. For example, the code = Table.SelectRows(Source, each [Sales] > 1000) filters rows where sales exceed 1000.
Tips for Beginners
- Explore Each Tab: Familiarize yourself with the Ribbon tabs to understand available transformations.
- Leverage Applied Steps: Use the Applied Steps pane to undo or adjust your actions without starting over.
- Preview Data Often: Keep an eye on the data preview to understand how each step affects your data.
- Use Rename Steps: Rename steps descriptively to keep your queries organized.
- Experiment Safely: Since changes are non-destructive and reversible, don’t hesitate to try different transformations.
Conclusion
The Power Query interface is a user-friendly yet powerful environment for data transformation in Excel. By understanding its components—Ribbon, Queries Pane, Data Preview, Applied Steps, and Formula Bar—beginners can confidently clean and reshape data for reporting and analysis. With practice and exploration, you can harness Power Query to automate repetitive tasks and enhance your data workflows.
Frequently Asked Questions
Related Articles
- Power Query Tutorial: Getting Started with Data Transformation
- How to Use Power Query in Excel for Efficient Data Cleaning
- Top 10 Excel Power Query Tips to Boost Your Data Analysis
- Mastering Data Transformation with Power Query: Step-by-Step Guide
- How to Merge Queries in Power Query for Advanced Data Analysis
Want practical Excel help?
Support free Excel tutorials, get weekly tips, or contact us for Excel programming, VBA, Power Query, dashboards, and automation work.