Grouping Data in Pivot Tables: A Guide to Organizing Your Data Efficiently
Introduction
Pivot tables are one of the most powerful tools in Excel for summarizing, analyzing, and presenting large sets of data. However, when you have complex datasets, simple pivot tables might not be enough. That’s where pivot table grouping data comes in—a technique that enables you to organize and categorize your data for clearer insights.
This comprehensive guide will walk you through the essentials of grouping data in pivot tables, practical examples to apply immediately, and advanced tips to optimize your data analysis workflow.
What is Pivot Table Grouping Data?
Grouping data in pivot tables means categorizing individual data points into meaningful groups or ranges. Instead of displaying every single value, you can consolidate data into groups to make patterns and trends easier to identify.
Excel allows you to group pivot table data by numeric ranges, dates, and text. This functionality helps to clean up cluttered reports and focus on summarized, actionable insights.
Why Use Grouping in Pivot Tables?
- Simplifies large datasets: Grouping condenses many values into manageable categories.
- Enhances readability: Organized groups make data easier to understand at a glance.
- Improves analysis: Identifying trends across groups is faster than scanning individual entries.
- Customizable: You control how to group data depending on your analysis needs.
How to Group Data in Pivot Tables: Step-by-Step Guide
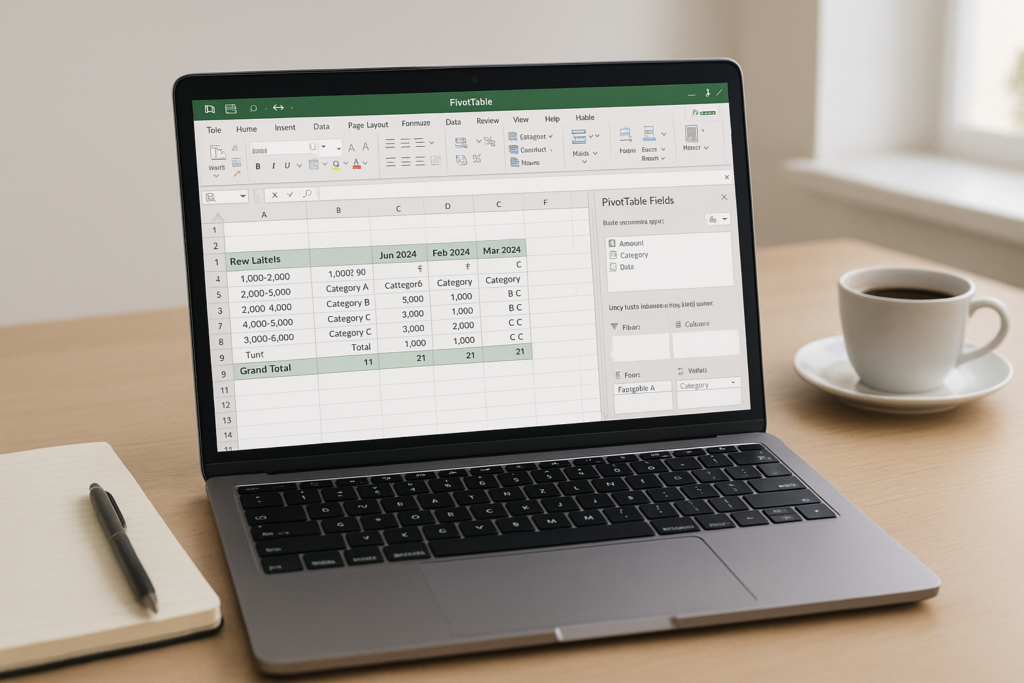
1. Grouping Numeric Data
Numeric data such as sales figures or ages can be grouped into ranges.
Example: Suppose you have sales data for multiple products and want to group sales amounts into ranges of $0-$500, $501-$1000, and so forth.
- Create your pivot table with Sales Amount in the Rows or Values area.
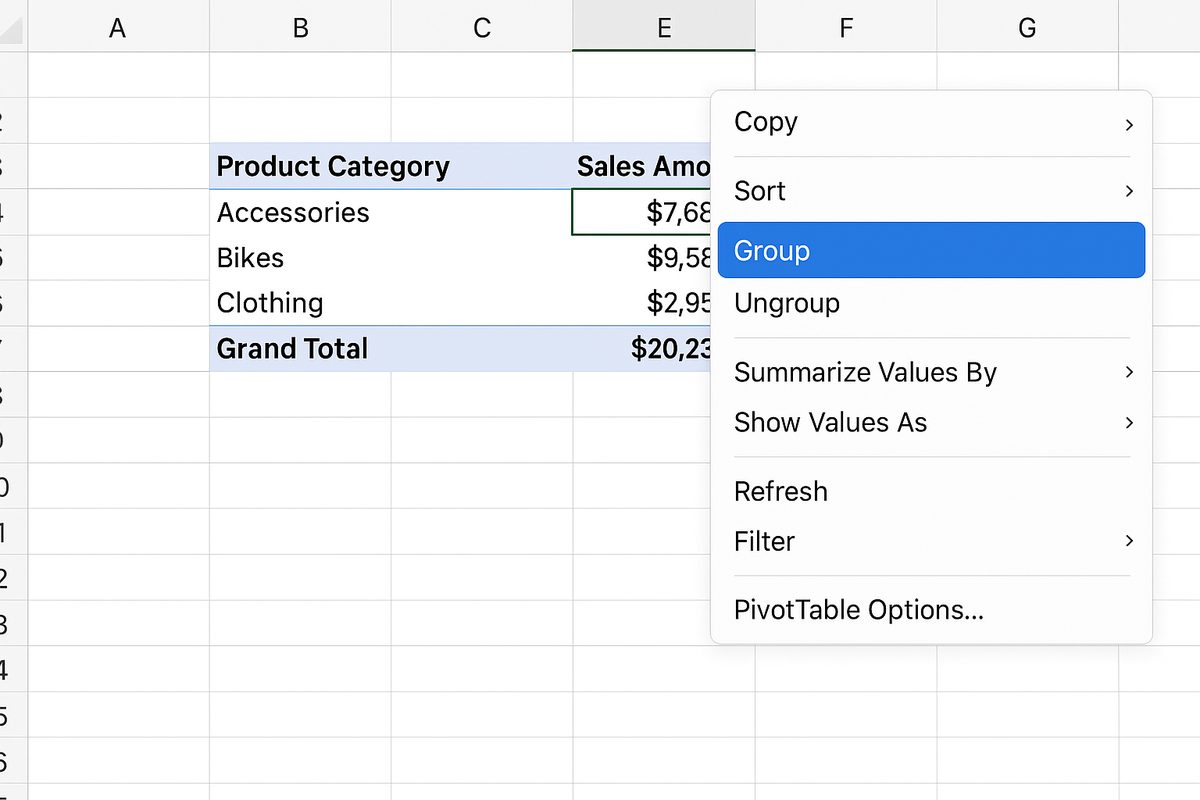
- Right-click any of the numeric values in the pivot table.
- Select Group from the context menu.
- In the Grouping dialog box, set the starting and ending values, then input the interval (e.g., 500).
- Click OK. The sales data will now be grouped into your specified ranges.
2. Grouping Date Data
Dates can be grouped by days, months, quarters, or years for trend analysis.
Example: You have order dates and want to group sales by month or quarter.
- Place your date field in Rows or Columns.
- Right-click any date entry in the pivot table.
- Choose Group.
- Select the grouping criteria such as Months and Quarters.
- Click OK to apply the grouping.
3. Grouping Text Data
While Excel does not automatically group text fields, you can manually group them.
Example: You have a list of products and want to group some related products together.
- Select multiple text items in your pivot table by holding Ctrl and clicking the items.
- Right-click one of the selected items and choose Group.
- Excel creates a new group with a default name like Group1, which you can rename.
Practical Example: Analyzing Sales Data with Grouped Pivot Tables
Imagine you have the following dataset with columns: Order Date, Product Category, Sales Amount.
You want to analyze total sales by product category and group sales amount into ranges to see which sales brackets contribute most.
- Create a pivot table with Product Category in Rows and Sales Amount in Values.
- Right-click any sales amount in the pivot table and select Group.
- Set the starting point (e.g., 0), ending point (e.g., 5000), and interval (e.g., 1000) to create ranges like 0-1000, 1001-2000, etc.
- Analyze which product categories have sales concentrated in specific ranges.
Advanced Tips for Pivot Table Grouping Data
- Use multiple grouping levels: Group dates by Year and Quarter simultaneously for layered insights.
- Rename groups for clarity: After grouping text items, rename groups with descriptive names for better report readability.
- Refresh pivot tables: After updating source data, refresh your pivot table to ensure groups update correctly.
- Ungroup when needed: Right-click grouped items and select Ungroup to revert to original data.
- Use calculated fields with groups: Enhance analysis by adding calculated fields that reference grouped data.
Common Issues and Troubleshooting
If you encounter errors or the Group option is grayed out, consider these points:
- Check for blanks: Grouping does not work if the data has blank cells. Fill or remove blanks.
- Mixed data types: Numeric and text mixed in the same field can prevent grouping.
- Source data format: Ensure your data is formatted correctly (dates as dates, numbers as numbers).
FAQ
Below are some frequently asked questions on pivot table grouping data.
Related Articles
- Pivot Tables Tutorial: A Beginner’s Guide to Summarizing Data
- What Is a Pivot Table and How Can It Help You Analyze Data?
- How to Create a Pivot Table in Excel Step-by-Step
- Understanding Pivot Table Fields: Rows, Columns, Filters, and Values Explained
- Advanced Pivot Table Techniques to Master Data Analysis
Want practical Excel help?
Support free Excel tutorials, get weekly tips, or contact us for Excel programming, VBA, Power Query, dashboards, and automation work.