Advanced Pivot Table Techniques to Master Data Analysis
Introduction
Pivot tables are one of the most powerful features in Microsoft Excel, enabling users to quickly summarize, analyze, and visualize large datasets. While many users are familiar with the basics, mastering advanced pivot table techniques can dramatically improve your data analysis efficiency and insights. This article will explore several advanced pivot table strategies, complete with practical examples, to help you become a pivot table expert.
1. Using Calculated Fields and Calculated Items
Calculated fields and calculated items allow you to add custom calculations to your pivot tables without modifying the original data source.
Example: Suppose you have sales data with columns for Region, Product, and Sales Amount. You want to calculate the sales tax (e.g., 8%) directly in the pivot table.
- Go to the Pivot Table Analyze tab, click Fields, Items & Sets, then select Calculated Field.
- Name the field “Sales Tax” and use the formula:
=Sales Amount * 0.08. - Click OK, and the new calculated field will appear in your pivot table.
This technique helps you add dynamic calculations that update automatically when the pivot table changes.
2. Grouping Data for Better Insights
Grouping enables you to organize data into meaningful ranges or categories.
Example: If you have dates in your data, you can group them by months, quarters, or years.
- Right-click a date in the pivot table and select Group.
- Choose grouping options such as Months, Quarters, or Years.
- Click OK to see the data summarized accordingly.
You can also group numeric data. For example, group sales amounts into ranges of $0-$100, $101-$500, etc., to analyze performance by sales brackets.
3. Using Slicers and Timelines for Interactive Filtering
Slicers and timelines provide a user-friendly way to filter pivot table data visually.
- Slicers: Perfect for categorical fields such as Region or Product. Insert slicers via Pivot Table Analyze > Insert Slicer and select the fields you want.
- Timelines: Designed to filter date fields interactively. Insert timelines via Pivot Table Analyze > Insert Timeline and select a date field.
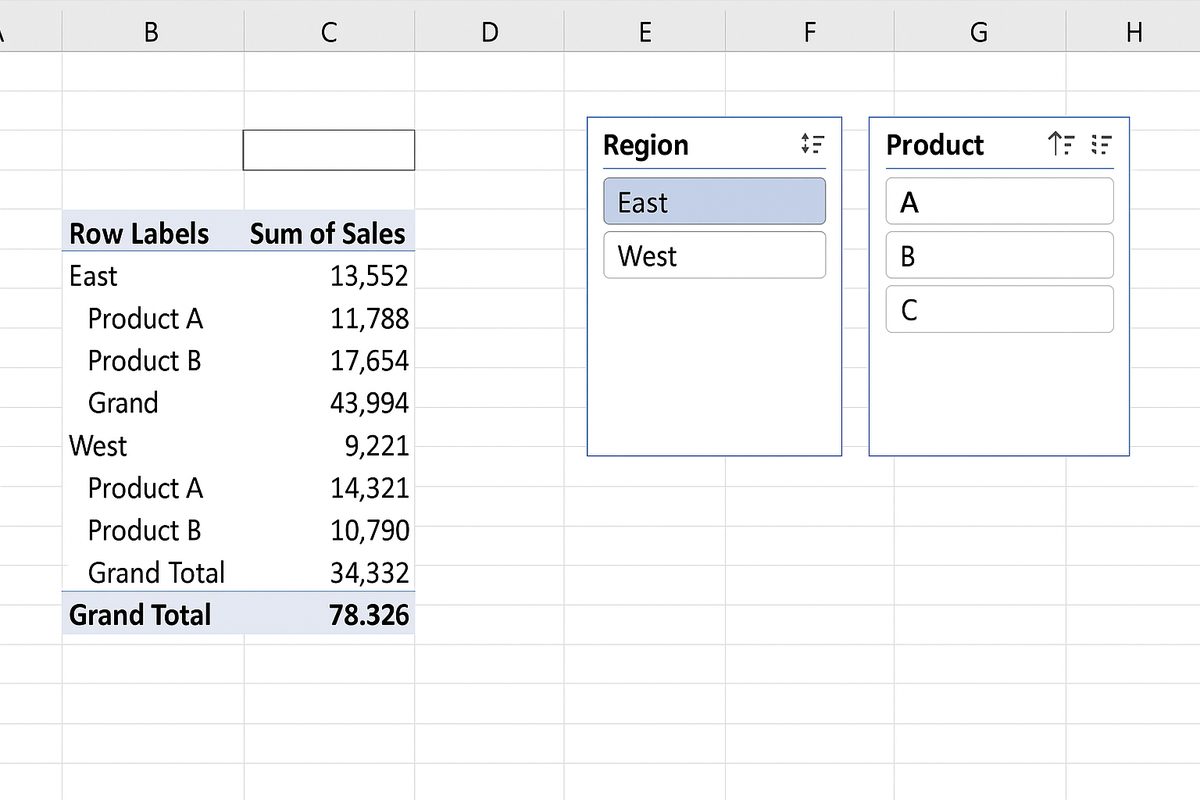
These tools allow you to quickly slice and dice data, making your reports more dynamic and easier to explore.
4. Leveraging Multiple Consolidation Ranges
This advanced feature lets you create pivot tables that consolidate data from multiple ranges or worksheets.
Example: You might have monthly sales data stored in separate sheets and want to analyze the total sales across all months.
- Start creating a pivot table and choose Multiple Consolidation Ranges as your data source.
- Define each range that contains your monthly data.
- Proceed to build the pivot table to see consolidated results.
This technique is useful for combining scattered data sets without merging them manually.
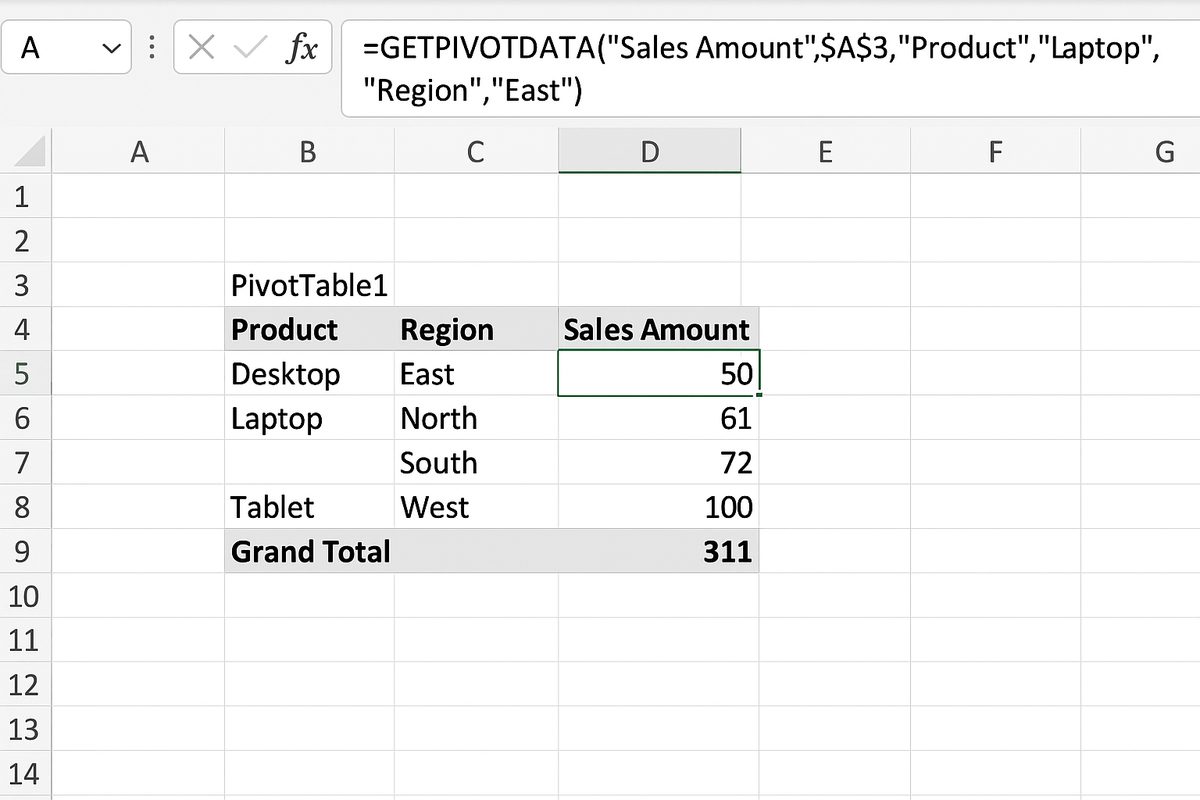
5. Using GetPivotData for Dynamic Reporting
GetPivotData is a powerful function that extracts specific data from a pivot table. It enables you to create dynamic reports that update automatically when the pivot table changes.
Example: To extract total sales for a specific product and region:
=GETPIVOTDATA("Sales Amount", $A$3, "Product", "Laptop", "Region", "East")
This function retrieves the sales amount for Laptops in the East region from the pivot table starting at cell A3.
Using GETPIVOTDATA makes your dashboard formulas more robust and less prone to errors.
6. Advanced Filtering with Report Filters and Value Filters
Beyond simple filtering, pivot tables allow you to use advanced filters to focus on specific data segments.
- Report Filters: Place fields in the filter area to pick specific values for the entire pivot table.
- Value Filters: Right-click a value field, select Filter > Value Filters to filter by top/bottom items, greater than, less than, etc.
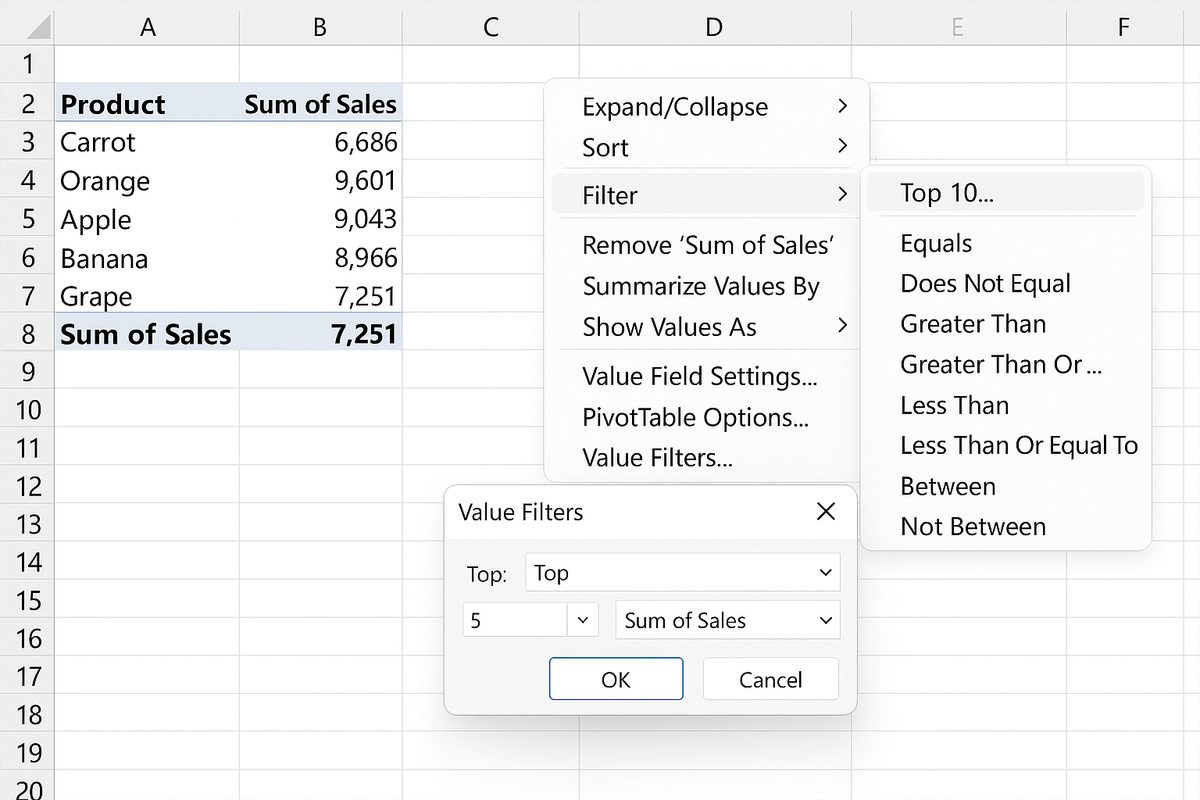
Example: To show only the top 5 products by sales, use Value Filters > Top 10 and set the criteria accordingly.
7. Using Power Pivot and Data Model Integration
For very large datasets or complex relationships, Power Pivot extends pivot table capabilities by allowing you to import multiple tables and create relationships between them.
Example: If you have separate tables for sales, products, and customers, you can load them into the Data Model and build pivot tables based on the combined data.
This approach supports advanced calculations using DAX formulas and improves performance with large data volumes.
Conclusion
Mastering advanced pivot table techniques is essential for anyone serious about Excel data analysis. By using calculated fields, grouping, slicers, multiple consolidation ranges, GETPIVOTDATA, advanced filters, and Power Pivot integration, you can transform raw data into meaningful insights quickly and efficiently. Practice these techniques to enhance your analytic skills and boost your productivity in Excel.
Frequently Asked Questions
Q1: Can I use calculated fields on data from external sources?
Yes, as long as the data is included in your pivot table’s source, calculated fields can be used regardless of the original data source.
Q2: How do slicers differ from regular filters?
Slicers provide a visual, interactive way to filter data with buttons, making it easier to use and understand than traditional dropdown filters.
Q3: What is the benefit of grouping dates in a pivot table?
Grouping dates helps summarize data at different time levels like months or quarters, enabling trend analysis and clearer reporting.
Q4: Is Power Pivot available in all versions of Excel?
Power Pivot is available in Excel Professional Plus, Office 365 ProPlus, and Excel standalone versions from 2013 onward but may not be included in all editions.
Q5: How can I prevent GETPIVOTDATA from generating formulas automatically?
You can toggle GETPIVOTDATA on/off by clicking the PivotTable Analyze tab and disabling the “Generate GetPivotData” option.
Related Articles
- Pivot Tables Tutorial: A Beginner’s Guide to Summarizing Data
- What Is a Pivot Table and How Can It Help You Analyze Data?
- How to Create a Pivot Table in Excel Step-by-Step
- Understanding Pivot Table Fields: Rows, Columns, Filters, and Values Explained
- Using Calculated Fields in Pivot Tables to Perform Custom Calculations
Want practical Excel help?
Support free Excel tutorials, get weekly tips, or contact us for Excel programming, VBA, Power Query, dashboards, and automation work.