How to Harness AI for Automating Data Analysis and Dashboards in Excel
Introduction
Excel remains one of the most powerful tools for data analysis and reporting, but the integration of Artificial Intelligence (AI) is transforming how users interact with their spreadsheets. From automating routine tasks to extracting insights from complex datasets, AI-enhanced Excel workflows are boosting productivity and enabling smarter decision-making.
In this article, we will explore practical ways to leverage AI within Excel to automate data analysis and build dynamic dashboards without requiring advanced programming knowledge. You’ll learn hands-on steps to apply AI features, formulas, and automation techniques that save time and improve accuracy.
Understanding AI Capabilities in Excel
Microsoft Excel now incorporates AI-driven features such as Ideas, Data Types, and dynamic arrays to help analyze data quickly. Additionally, users can integrate Python scripts or Power Query with AI models to extract insights from unstructured data sources.
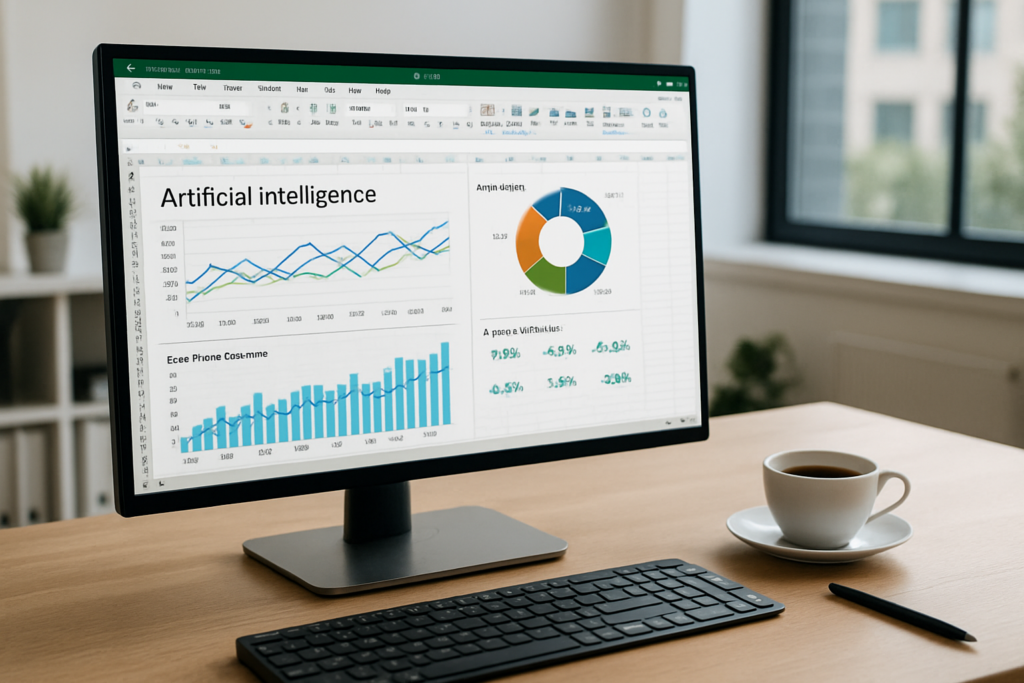
For example, AI can help identify patterns, forecast trends, or even extract data from images and videos to populate your spreadsheets automatically. These features reduce manual data entry and enable more interactive, real-time dashboards.
Step 1: Use Excel Ideas to Get Instant Insights
Excel’s Ideas tool uses AI to analyze your data and generate summaries, trends, and charts.
-
- Open your Excel worksheet containing data.
- Select any cell within your data table.
- On the Home tab, click Ideas in the ribbon.
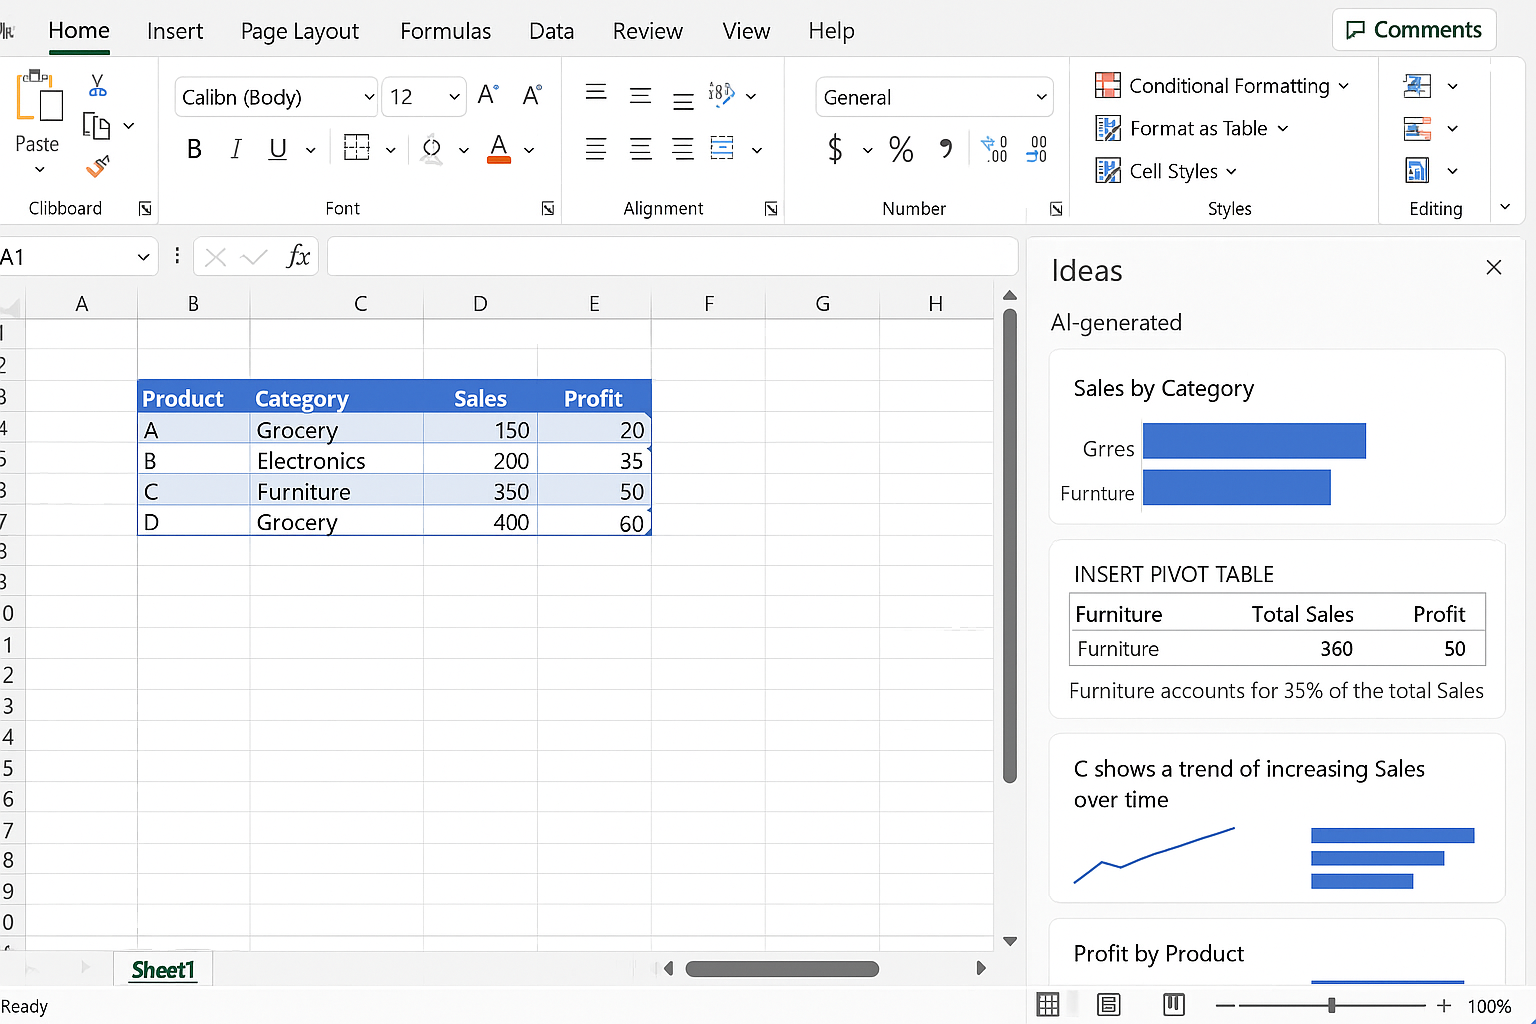
- Review the suggested insights including charts, pivot tables, or trend analyses.
- Click on any suggestion to insert it directly into your worksheet.
This feature quickly identifies key takeaways without writing formulas or creating charts manually.
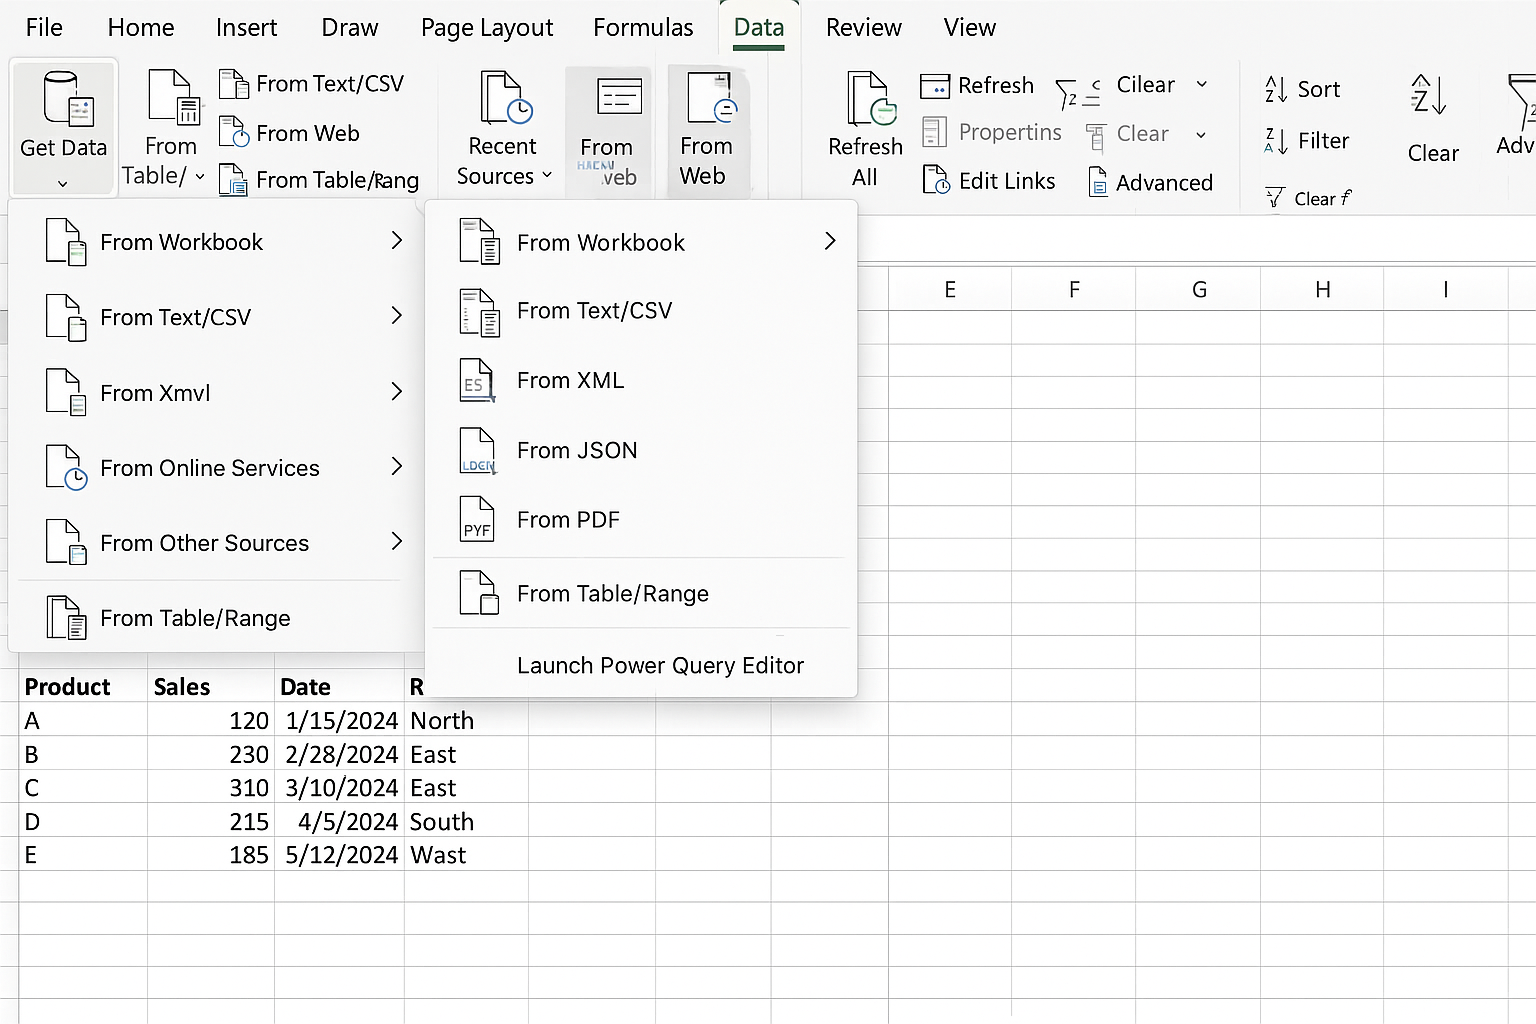
Step 2: Automate Data Transformation with Power Query and AI
Power Query allows you to extract, transform, and load (ETL) data efficiently, and it can be combined with AI services for advanced scenarios.
-
- Go to the Data tab and select Get Data > From File or From Web to import your data.
-
- In the Power Query Editor, use transformation tools like filters, splits, and merges to clean your data.
- Optionally, connect Power Query to AI services (such as Azure Cognitive Services) to analyze text or image data.
- Click Close & Load to push the processed data back into Excel.
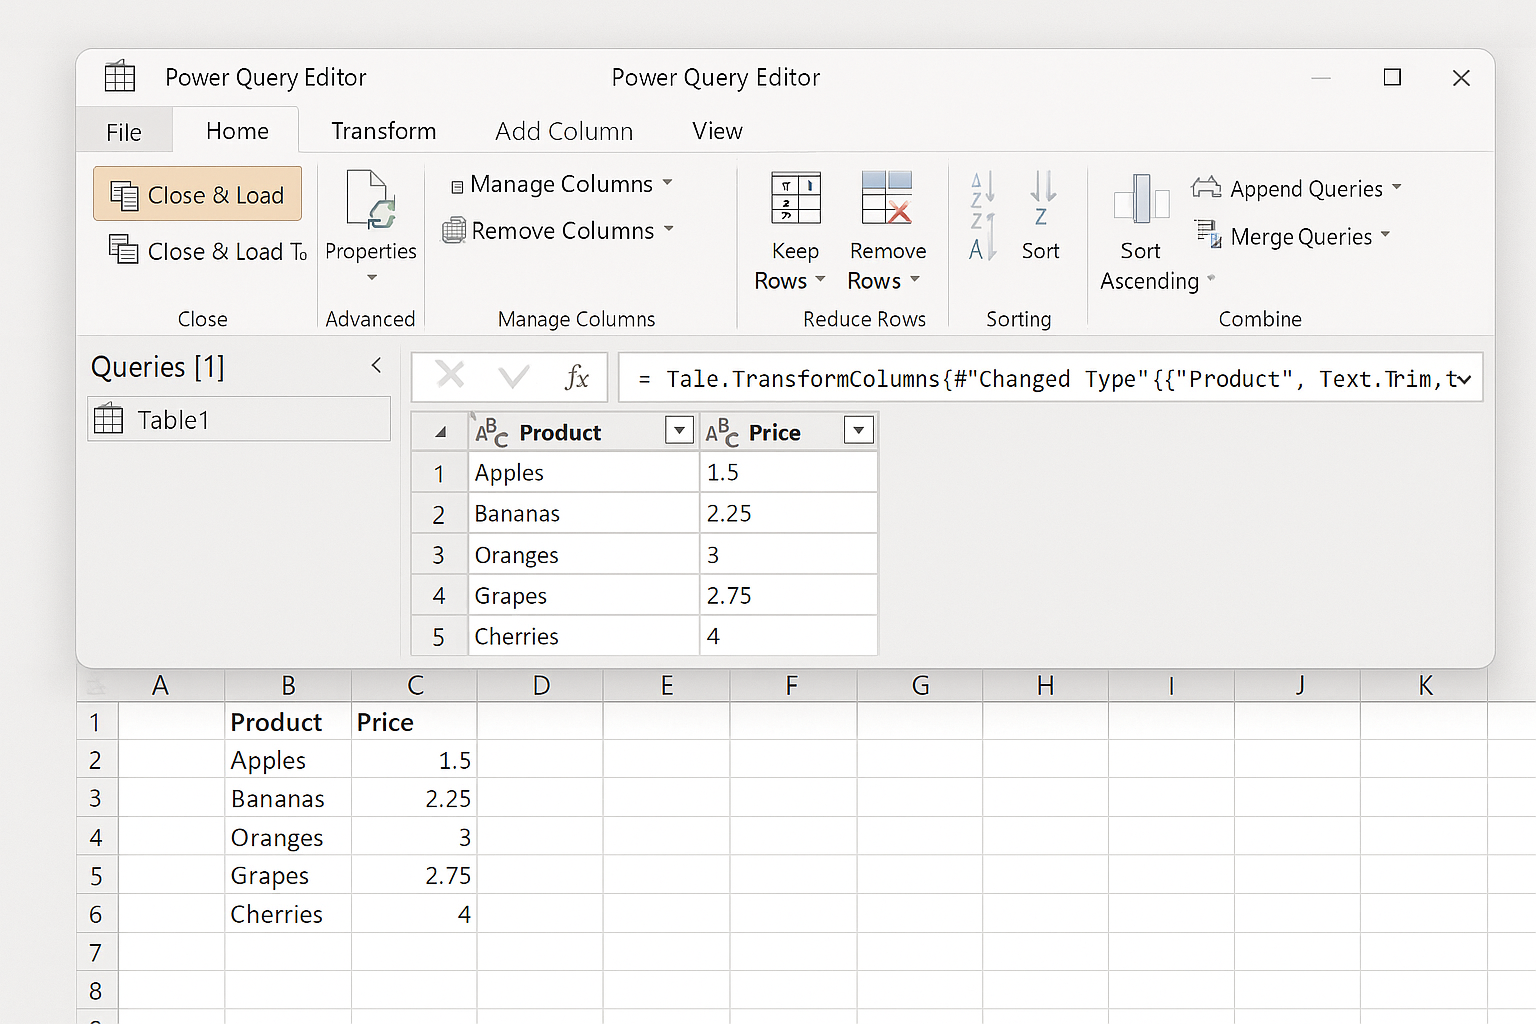
This automation pipeline reduces manual data prep and integrates AI insights directly into your spreadsheets.
Step 3: Create Dynamic Dashboards with AI-Powered Formulas
Dynamic arrays and AI-enhanced formulas allow dashboards to update automatically as data changes.
-
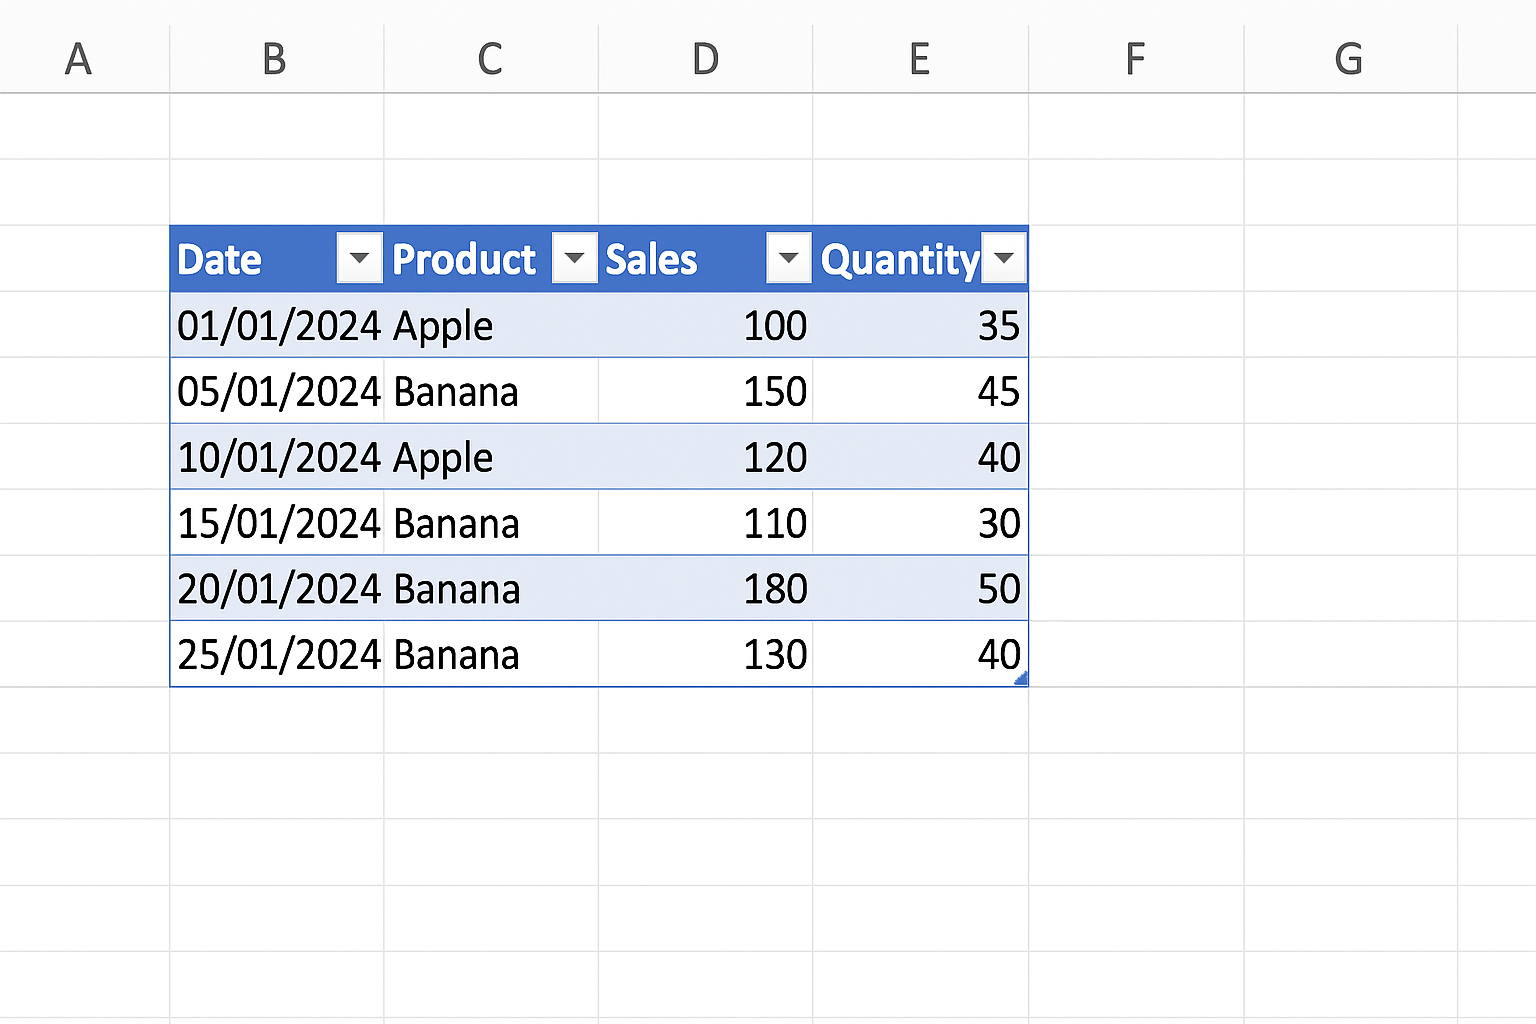
- Insert a table for your dataset: select your data range and press Ctrl + T.
-
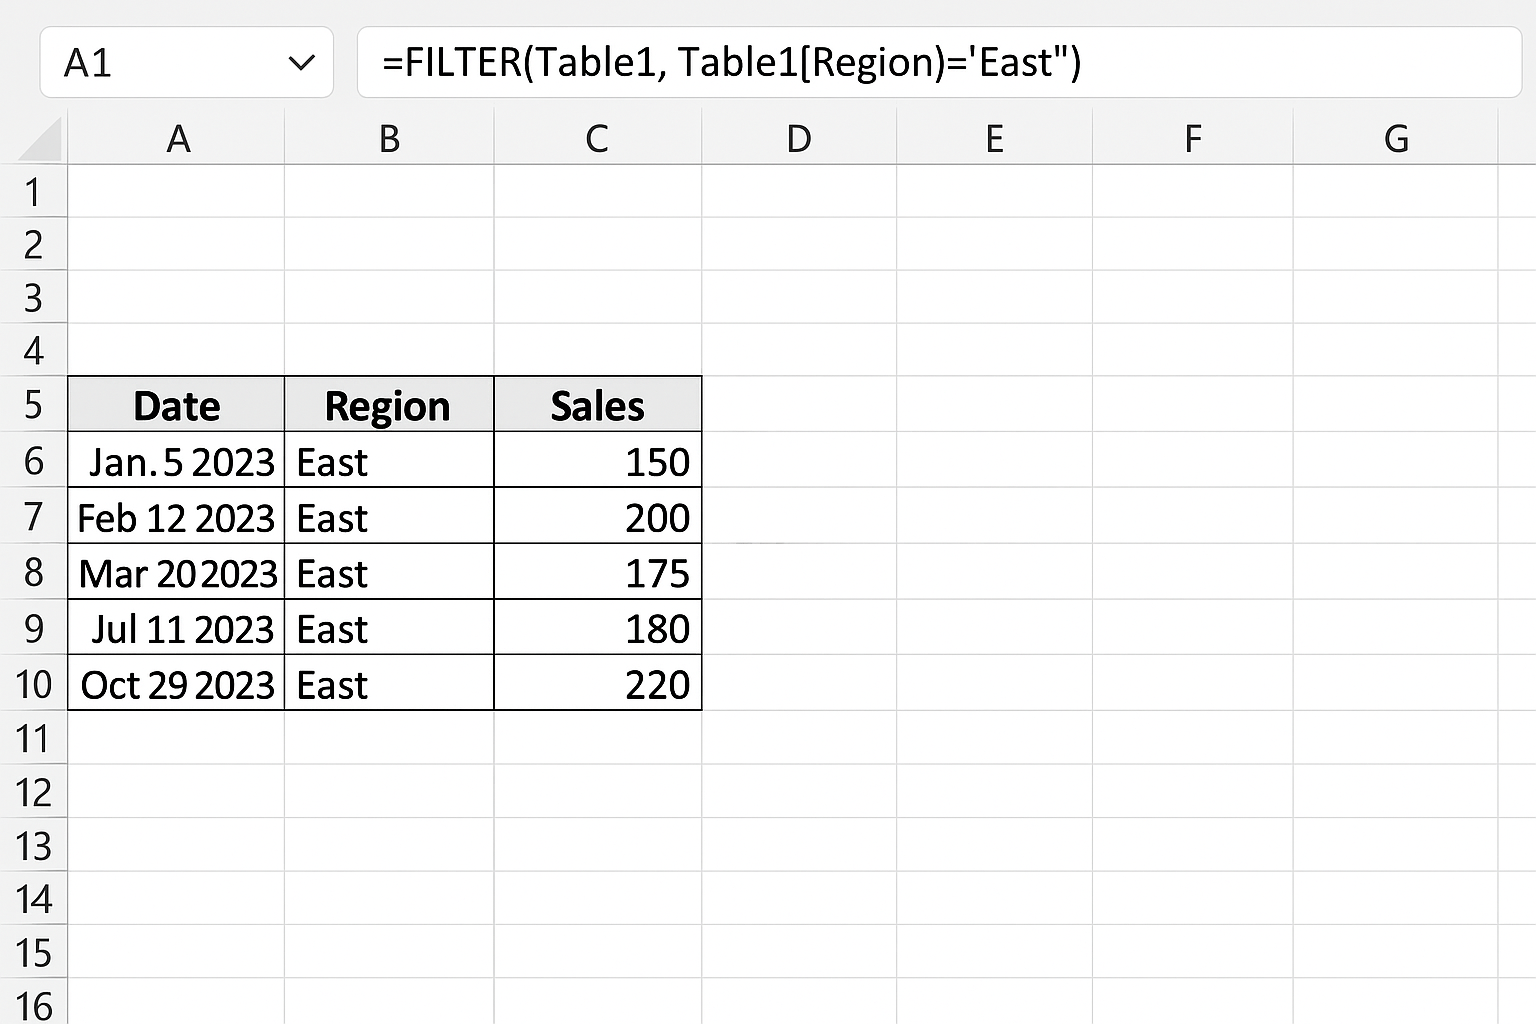
- Use the
FILTER()function to display only relevant data. For example,=FILTER(Table1, Table1[Region]="East")shows East region sales.
- Use the
- Apply the
UNIQUE()function to generate dropdown lists or summary tables. - Use
XLOOKUP()to fetch data dynamically based on user inputs. - Incorporate conditional formatting to highlight trends or outliers automatically.
These formulas create interactive elements in your dashboard that respond to data updates, minimizing manual adjustments.
Step 4: Integrate Python Scripts to Process AI Models
Excel now supports running Python scripts for advanced AI-powered data analysis.
-
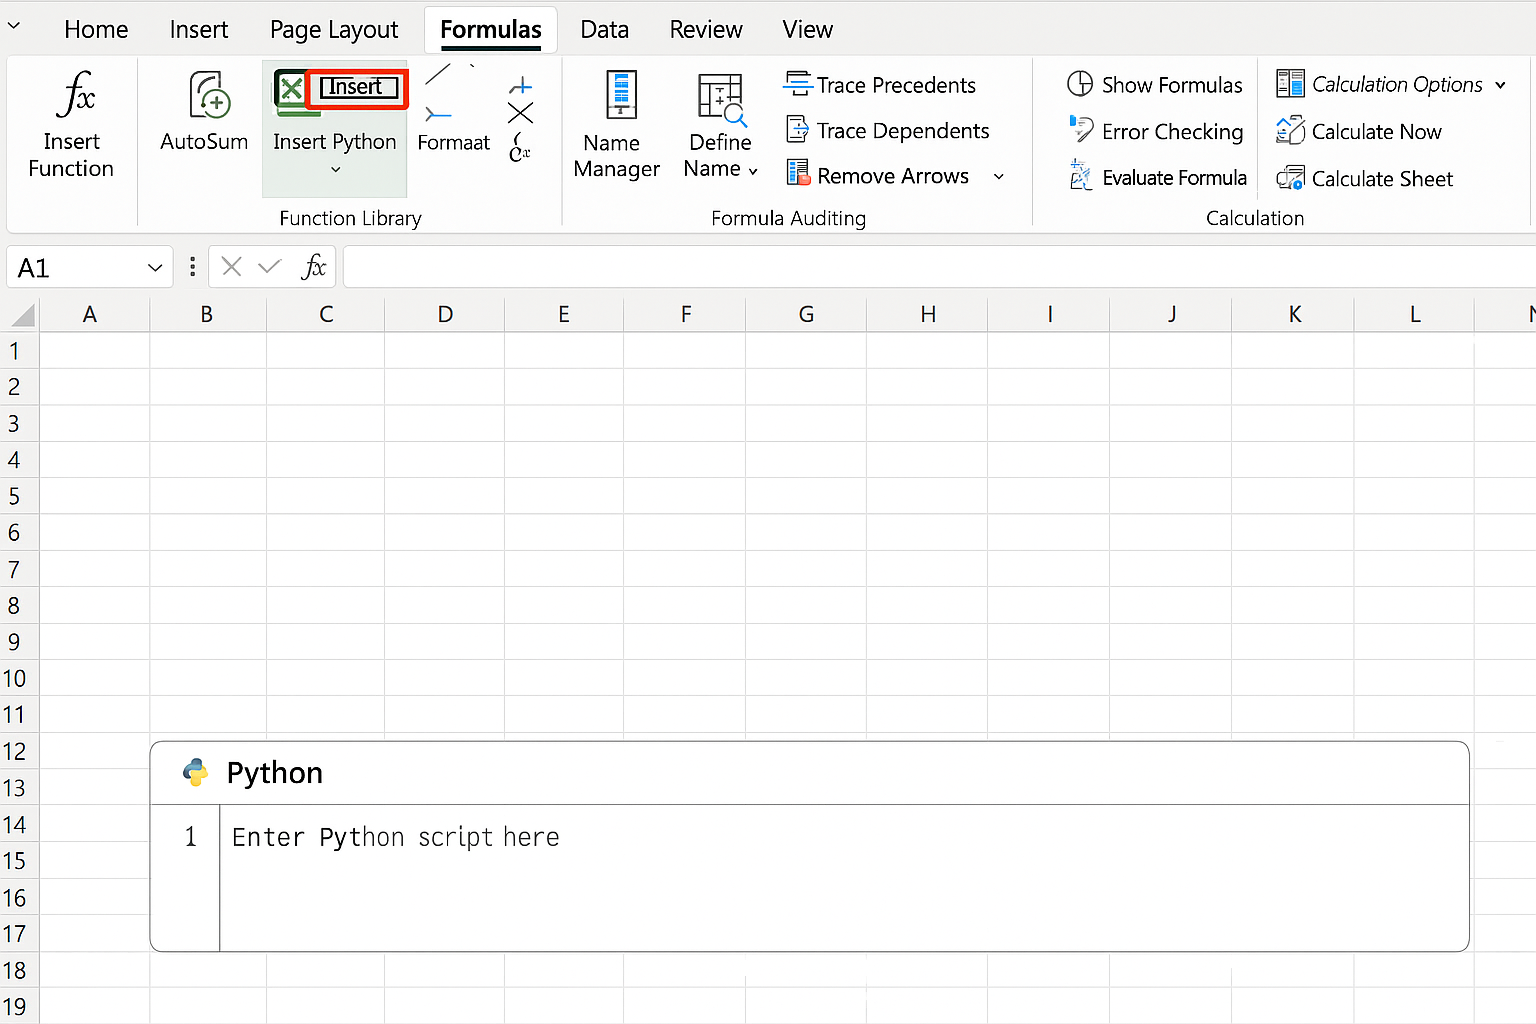
- Ensure you have Python enabled in your Excel version (currently in preview or via add-ins).
- Open the Formulas tab and select Insert Python (or use the Python editor add-in).
- Write Python code to process data, for example, use machine learning libraries like
pandasandscikit-learnfor forecasting. - Return the processed results back into Excel cells dynamically.
This approach allows you to harness AI models directly within the familiar Excel interface.
Practical Example: Automating Sales Forecast Dashboard
Suppose you have monthly sales data and want to create an automated dashboard forecasting next quarter sales.
- Import your sales data into an Excel table.
- Use Ideas to identify trends and insert charts.
- In Power Query, clean data and add calculated columns for seasonality.
- Use the
FORECAST.ETS()function:=FORECAST.ETS(FutureDate, SalesRange, DateRange)to predict future sales. - Create slicers linked to your table for interactive filtering by region or product.
- Apply conditional formatting to highlight months where sales exceed targets.
Your dashboard now updates automatically as new data arrives, providing real-time insights with minimal manual effort.
FAQ
Can I use AI features in Excel without coding?
Yes, Excel’s Ideas tool and Power Query provide AI-powered data analysis and transformation without requiring any coding skills.
How does Python integration enhance Excel’s AI capabilities?
Python allows running advanced AI and machine learning models within Excel, enabling complex data processing beyond native Excel functions.
Are AI features available in all Excel versions?
Some AI features like Ideas and dynamic arrays are available in Microsoft 365 subscriptions, while Python integration may require preview versions or add-ins.
Can AI help in cleaning messy Excel data?
Yes, AI-powered Power Query transformations and data types can automate cleaning and standardizing data efficiently.
Is it possible to automate Excel dashboards to update from live data sources?
By using Power Query connected to live data and AI-enhanced formulas, you can create dashboards that refresh automatically with current data.
Conclusion
Artificial Intelligence is becoming a powerful ally in Excel for automating data analysis and dashboard creation. By leveraging built-in AI tools like Ideas, Power Query, dynamic formulas, and Python integration, users can save time, reduce errors, and gain deeper insights from their data. Whether you are a beginner or an advanced user, incorporating AI-driven automation into your Excel workflows will transform your productivity and help you make smarter decisions faster.
Want practical Excel help?
Support free Excel tutorials, get weekly tips, or contact us for Excel programming, VBA, Power Query, dashboards, and automation work.