How to Analyze Marketing Data Effectively with Pivot Tables

Introduction
In today’s data-driven marketing landscape, the ability to analyze and interpret data efficiently is paramount. Pivot tables provide a powerful way to summarize, explore, and gain insights from complex marketing datasets. Whether you’re tracking campaign performance, customer behavior, or sales trends, a pivot table for marketing data can save you time and help you make data-backed decisions.
What is a Pivot Table?
A pivot table is an interactive tool in Excel that allows users to reorganize and summarize large datasets quickly. It enables marketers to extract meaningful patterns and trends by aggregating data without altering the original dataset. Pivot tables support various functions such as sum, average, count, and more, making them ideal for analyzing marketing metrics.
Why Use Pivot Tables for Marketing Data?
- Efficiency: Quickly summarize large volumes of data without complex formulas.
- Flexibility: Customize views dynamically to explore data from different perspectives.
- Insightful Reporting: Identify trends, outliers, and key performance indicators with ease.
- Data Segmentation: Segment data by campaign, region, date, or customer demographics.
Step-by-Step Guide: Creating a Pivot Table for Marketing Data
Let’s walk through creating a pivot table using a sample marketing dataset containing campaign names, dates, impressions, clicks, and conversions.
Step 1: Prepare Your Data
Ensure your data is in a tabular format with clear headers and no blank rows or columns. Example dataset columns: Campaign, Date, Impressions, Clicks, Conversions.
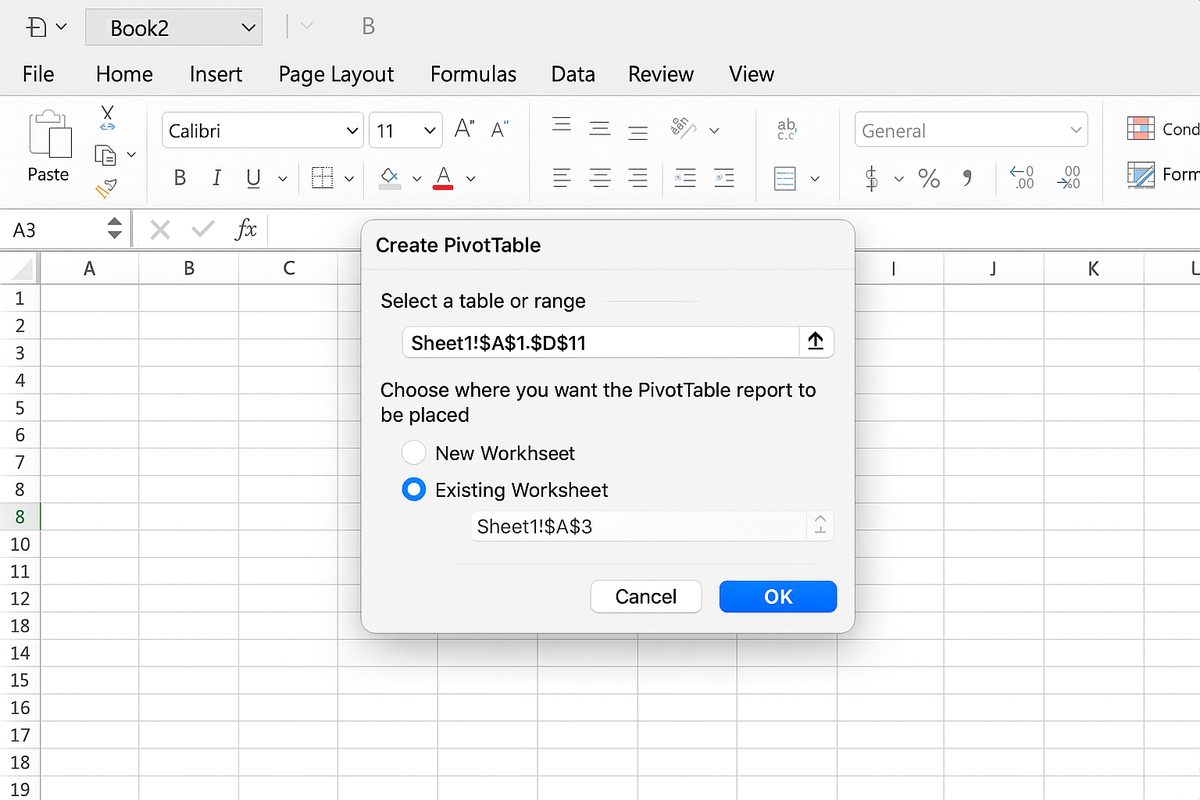
Step 2: Insert a Pivot Table
- Select any cell in your dataset.
- Go to the Insert tab and click PivotTable.
- Choose where to place the pivot table and click OK.
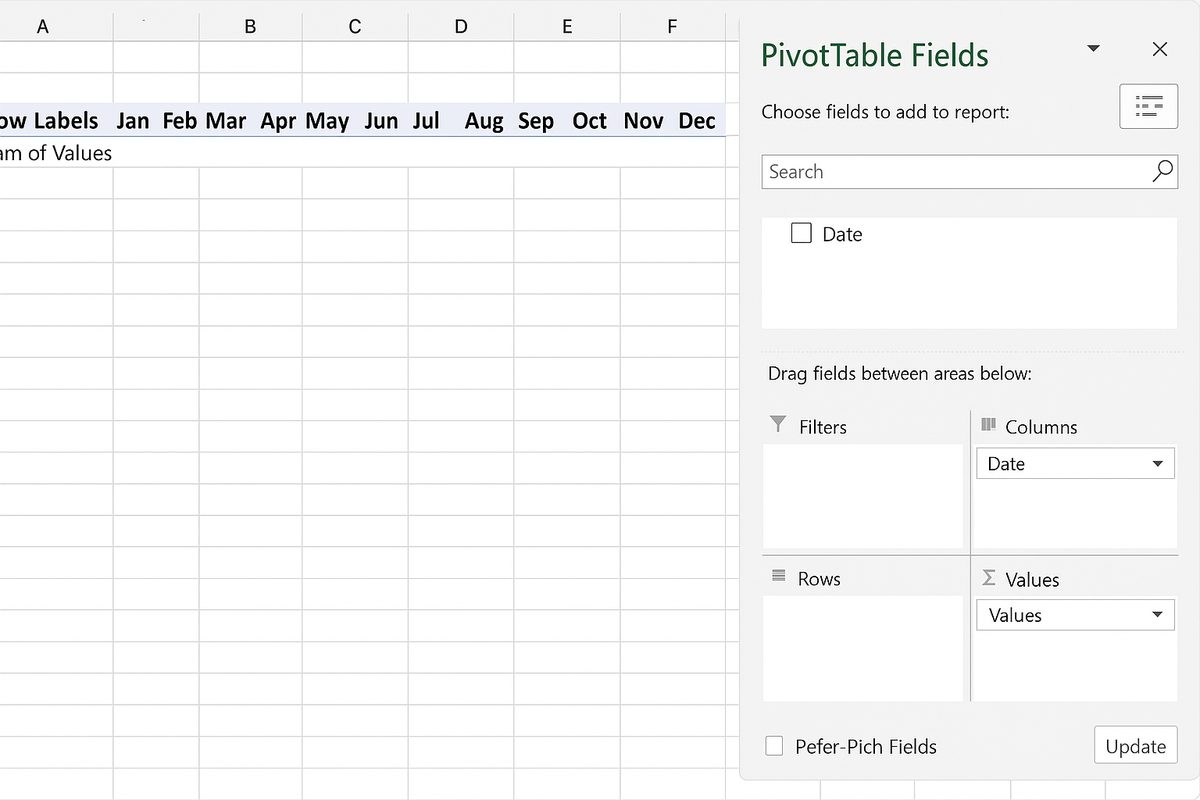
Step 3: Configure Pivot Table Fields
- Rows: Drag Campaign to the Rows area to analyze data by campaign.
- Columns: Drag Date (or group by month) to Columns to view performance over time.
- Values: Add Impressions, Clicks, and Conversions to Values to summarize totals.
Step 4: Analyze Metrics
Pivot tables allow you to calculate additional metrics such as click-through rate (CTR) or conversion rate by adding calculated fields or formulas outside the pivot table.
Practical Examples of Pivot Tables for Marketing Data
Example 1: Campaign Performance Overview
Use a pivot table to compare total impressions, clicks, and conversions across multiple campaigns. This helps identify which campaigns are driving the most engagement and conversions.
Example 2: Monthly Trend Analysis
Group your date field by month in the pivot table to analyze how campaign performance evolves over time, spotting seasonal trends or sudden changes.
Example 3: Customer Segmentation
If your dataset includes customer demographics, use pivot tables to segment data by age group, location, or device to understand which segments respond best to your marketing efforts.
Example 4: ROI Calculation
Integrate cost data and revenue from campaigns within pivot tables to calculate return on investment (ROI) by campaign or channel.
Tips for Optimizing Pivot Table Use in Marketing
- Clean Data: Remove duplicates and errors before pivot analysis.
- Use Slicers: Add slicers for easy filtering by campaign, date, or other dimensions.
- Group Dates: Group dates by weeks, months, or quarters for better time-based insights.
- Refresh Data: Always refresh your pivot table after updating the source data.
- Visualize: Combine pivot tables with charts for compelling marketing dashboards.
Common Challenges and How to Overcome Them
Large Datasets: Use Excel’s Data Model and Power Pivot for handling big marketing datasets efficiently.
Dynamic Data: Use dynamic named ranges or Excel tables to ensure pivot tables update automatically with new data.
Complex Calculations: Utilize calculated fields or DAX formulas in Power Pivot for advanced marketing metrics.
Conclusion
Pivot tables are an essential tool in the marketer’s toolkit for analyzing and interpreting large volumes of marketing data. By summarizing key metrics, segmenting audiences, and revealing trends, pivot tables enable marketers to make informed decisions quickly and confidently. With practice, you can leverage pivot tables to transform raw marketing data into actionable insights that drive better campaign outcomes and higher ROI.
Frequently Asked Questions
Related Articles
- Pivot Tables Tutorial: A Beginner’s Guide to Summarizing Data
- What Is a Pivot Table and How Can It Help You Analyze Data?
- How to Create a Pivot Table in Excel Step-by-Step
- Understanding Pivot Table Fields: Rows, Columns, Filters, and Values Explained
- Advanced Pivot Table Techniques to Master Data Analysis