How to Build Excel Dashboards That Impress Stakeholders

Introduction
Excel dashboards are powerful tools that allow you to visualize complex data sets and present actionable insights in a clear and compelling manner. Building Excel dashboards that impress stakeholders requires a combination of data organization, design skills, and Excel functionality knowledge. This article will guide you through the essential steps to build Excel dashboards from scratch, including practical examples and hands-on instructions.
Step 1: Plan Your Dashboard Layout and Objectives
Before diving into Excel, identify the key metrics and data points your stakeholders care about. Determine the purpose of the dashboard: Is it for tracking sales performance, monitoring project status, or analyzing customer feedback? Sketch a rough layout to organize which charts, tables, and KPIs you want to include.
Example: If you are building a sales dashboard, your layout might include total sales, sales by region, top products, and monthly trends.
Step 2: Prepare Your Data
Clean and organize your raw data in Excel. Use a separate worksheet for raw data to keep things tidy.
- Action Step: Open Excel and paste or import your data into a sheet named Data.
- Ensure your data is in a tabular format with headers in the first row.
- Remove duplicates and fix inconsistencies.
Example: Your sales data table might include columns like Date, Region, Product, Quantity Sold, and Revenue.
Step 3: Use Excel Tables for Dynamic Data Ranges
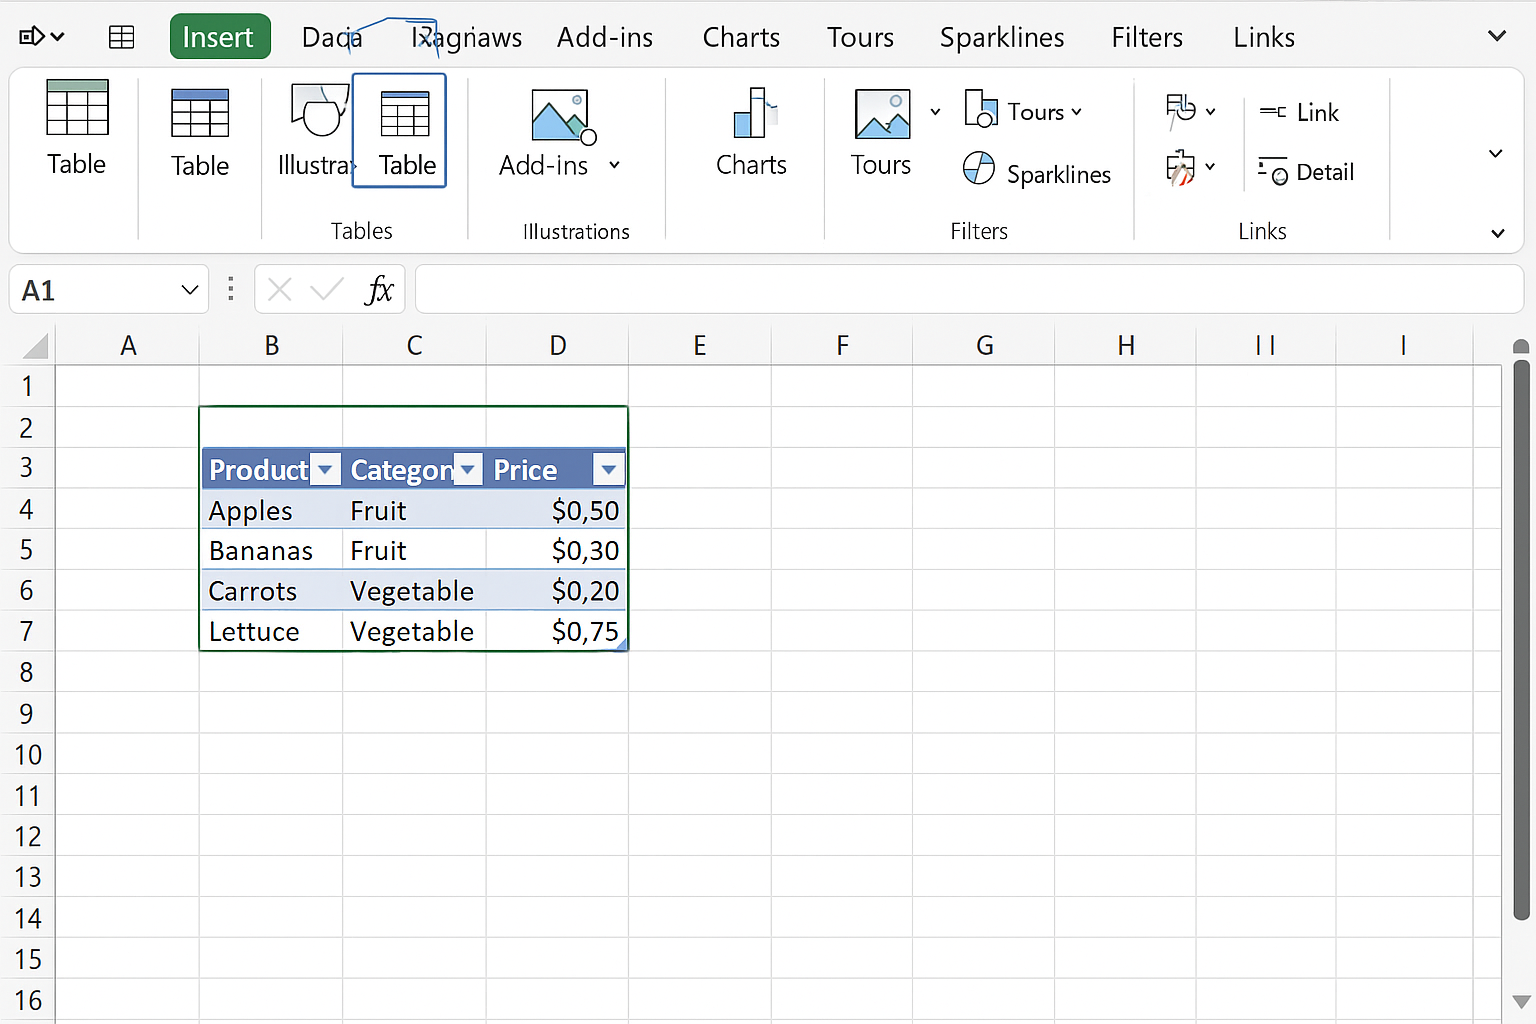
Convert your data range into an Excel Table to make formulas and charts dynamic as new data is added.
- Action Step: Select your data range, then go to the Insert tab and click Table. Confirm the range and check “My table has headers.”
This allows charts and pivot tables to automatically include new data rows.
Step 4: Create Pivot Tables for Summarized Views
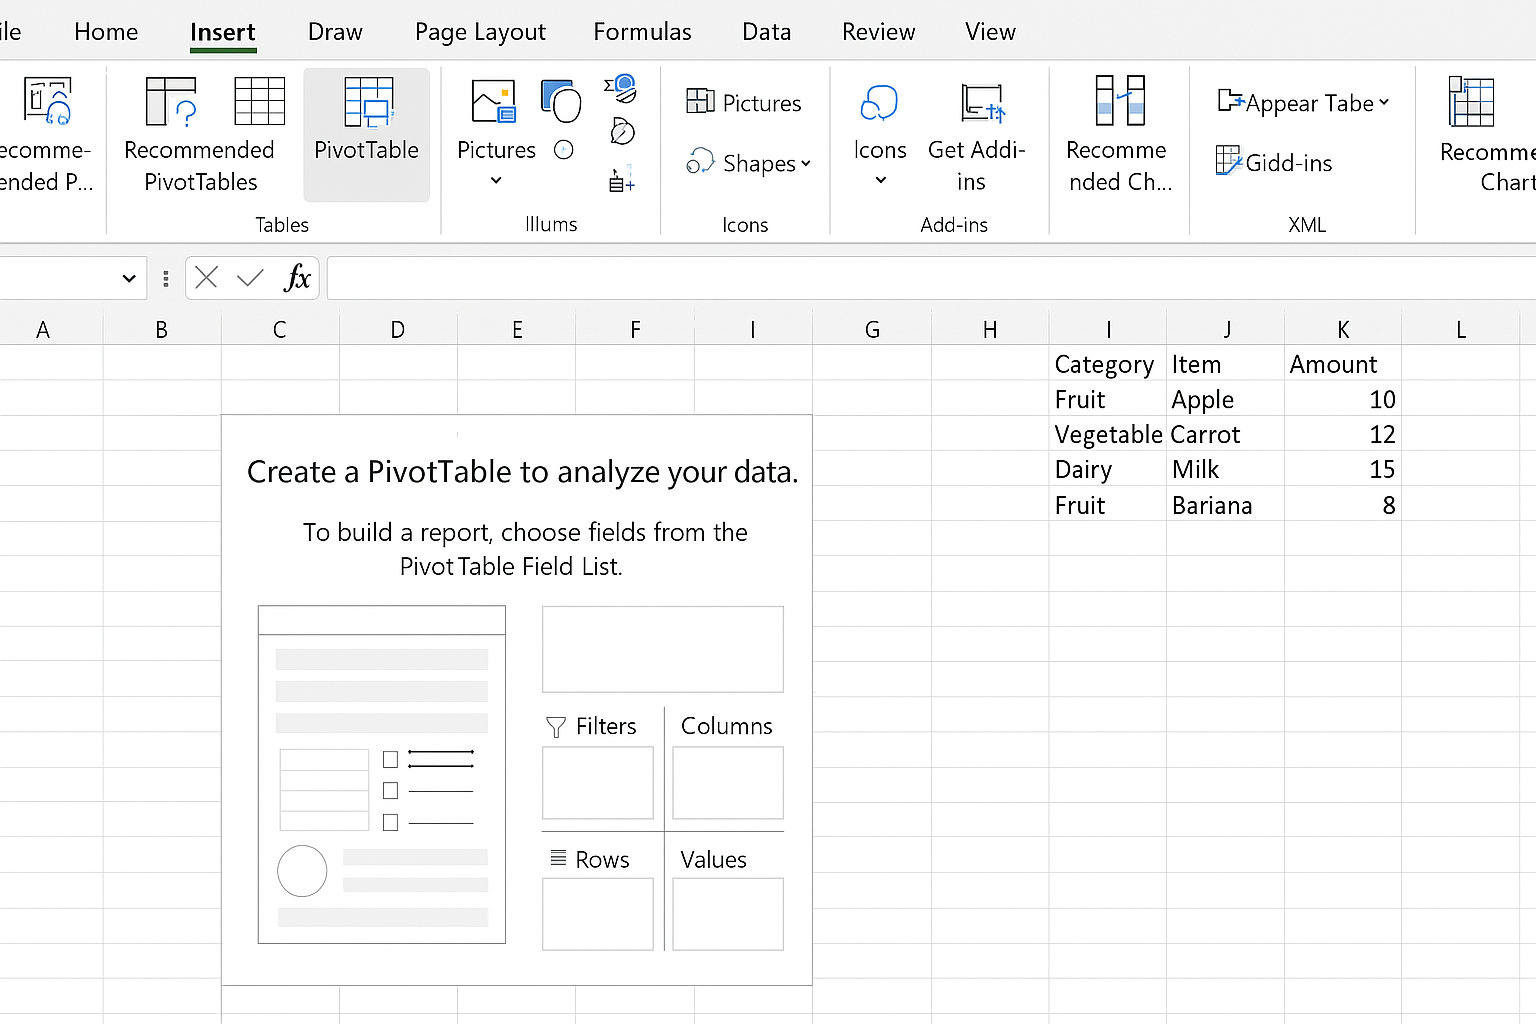
Pivot tables help you summarize and analyze your data quickly.
- Action Step: Select any cell in your Excel Table, then go to Insert > PivotTable. Choose to place the pivot table in a new worksheet.
- Drag relevant fields to Rows, Columns, and Values areas to create summaries. For example, drag Region to Rows and Revenue to Values to see revenue by region.
Step 5: Build Visualizations with Charts
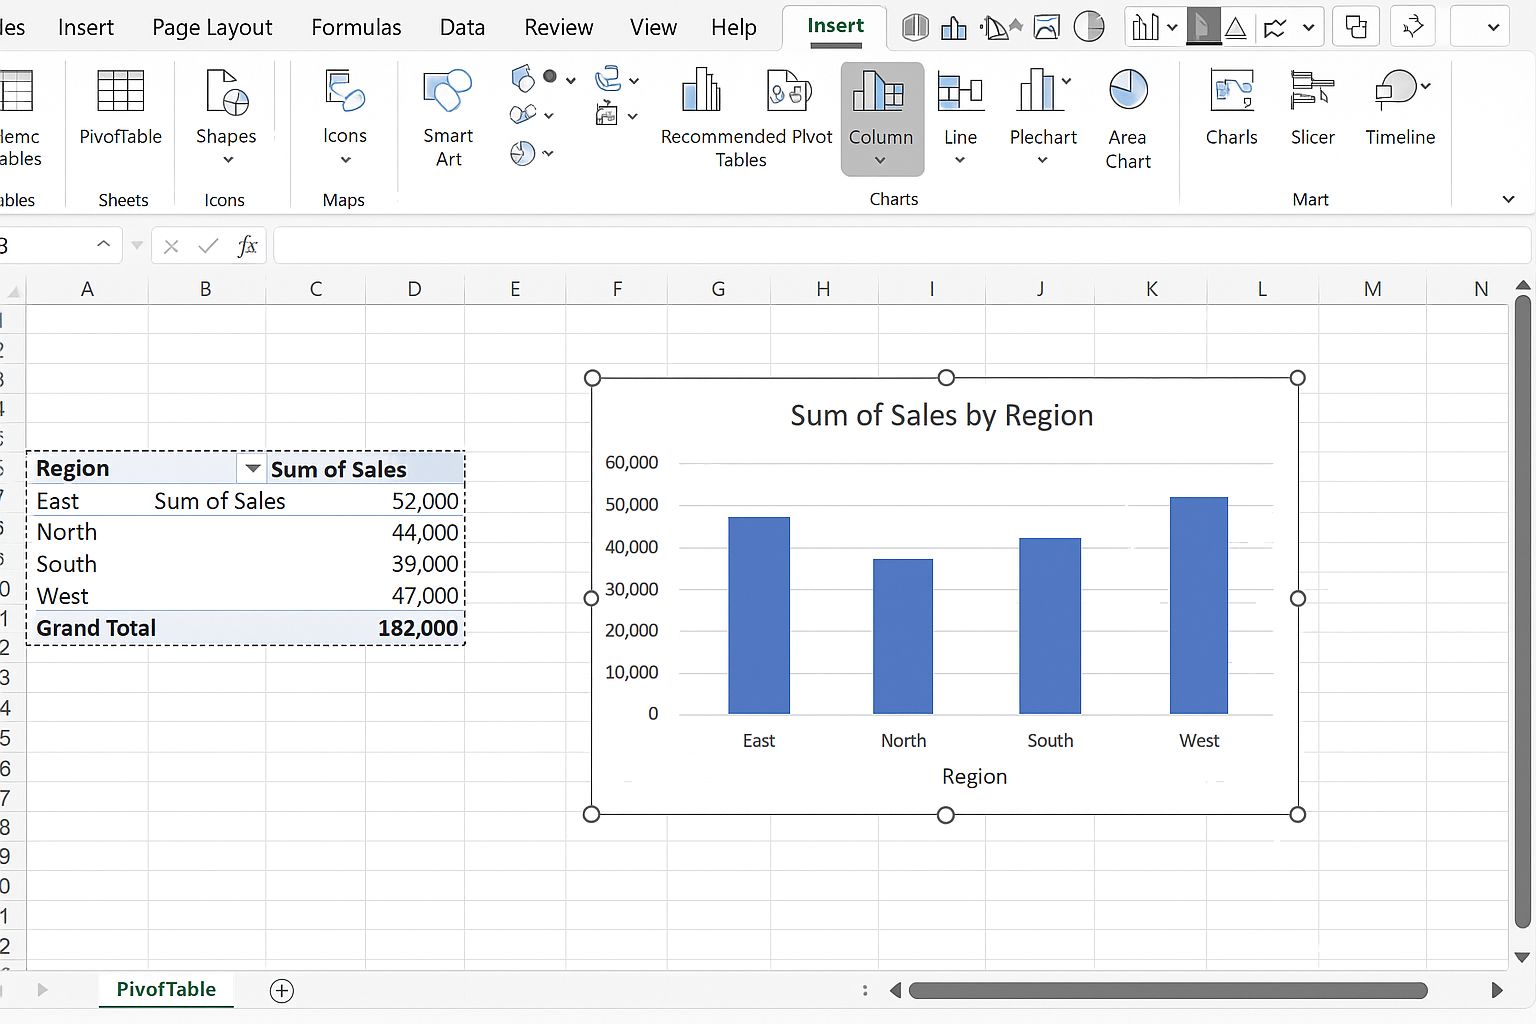
Charts make your data visually appealing and easier to interpret.
-
- Action Step: Select the pivot table or data range you want to chart.
- Navigate to the Insert tab and choose chart types like Column, Line, or Pie charts depending on what best represents your data.
- Use Slicer controls (Insert > Slicer) to add interactivity, allowing stakeholders to filter data by categories such as Region or Product.
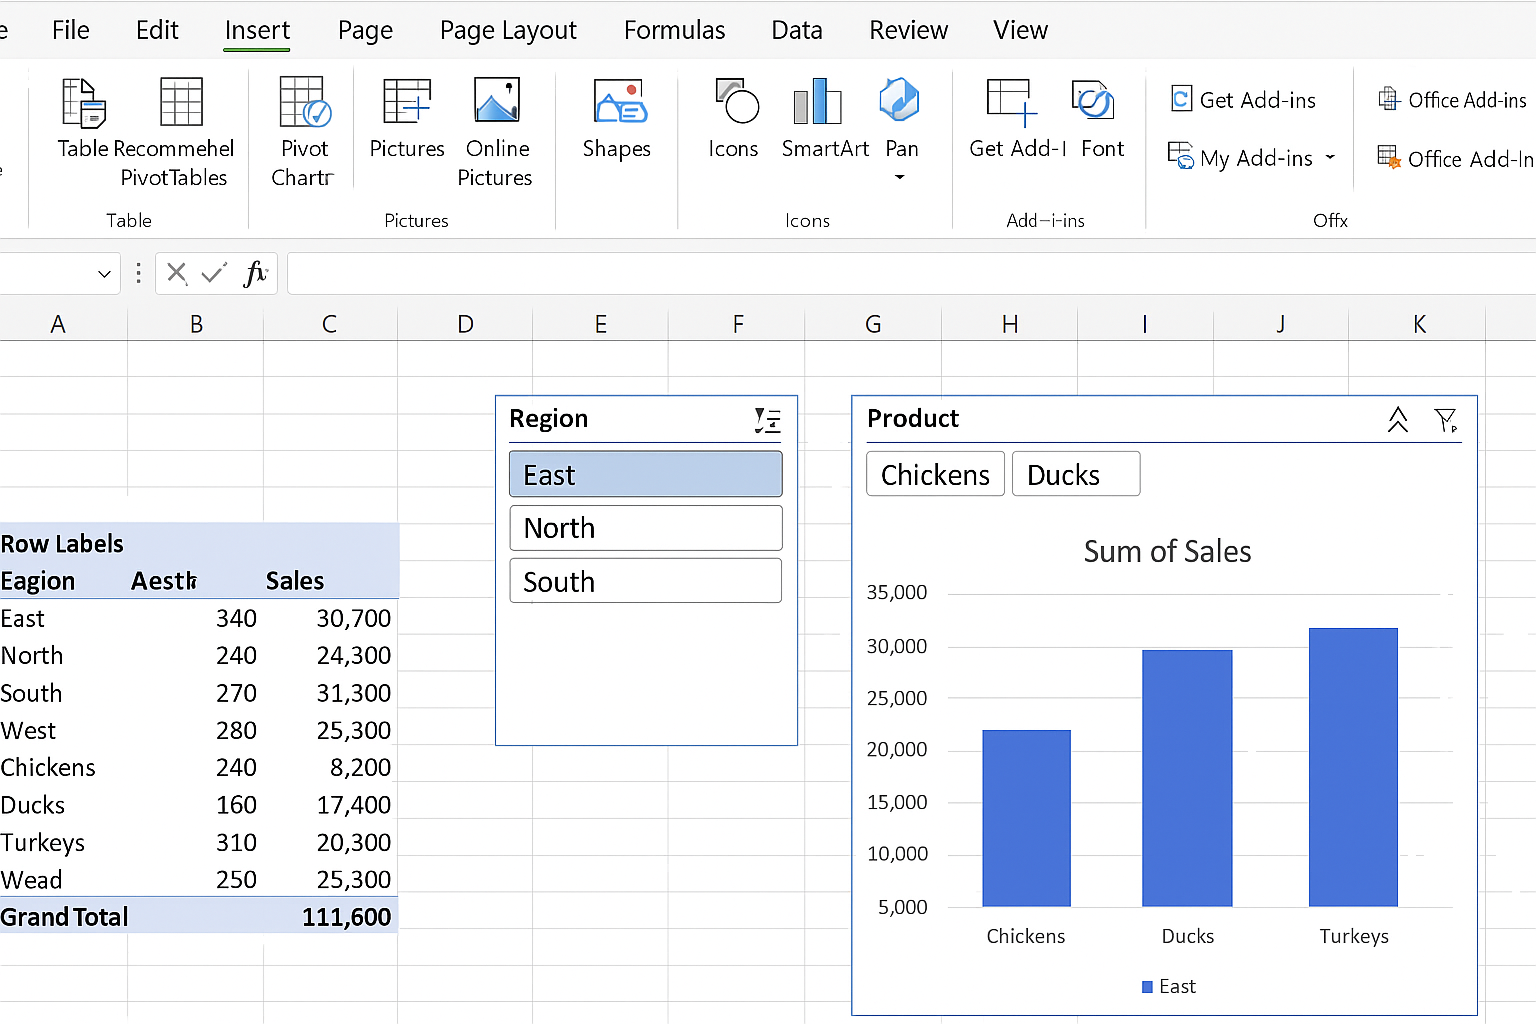
Example: Insert a column chart to show monthly sales trends and add slicers for filtering by product category.
Step 6: Design Your Dashboard Layout
On a new worksheet (name it Dashboard), arrange your charts and key metrics logically. Use text boxes to add titles and descriptions.
- Action Step: Resize charts and position slicers to create a clean, organized layout.
- Format charts with consistent colors and fonts that align with your company branding.
Step 7: Add KPIs with Conditional Formatting
Highlight essential numbers with conditional formatting to draw attention to key performance indicators.
-
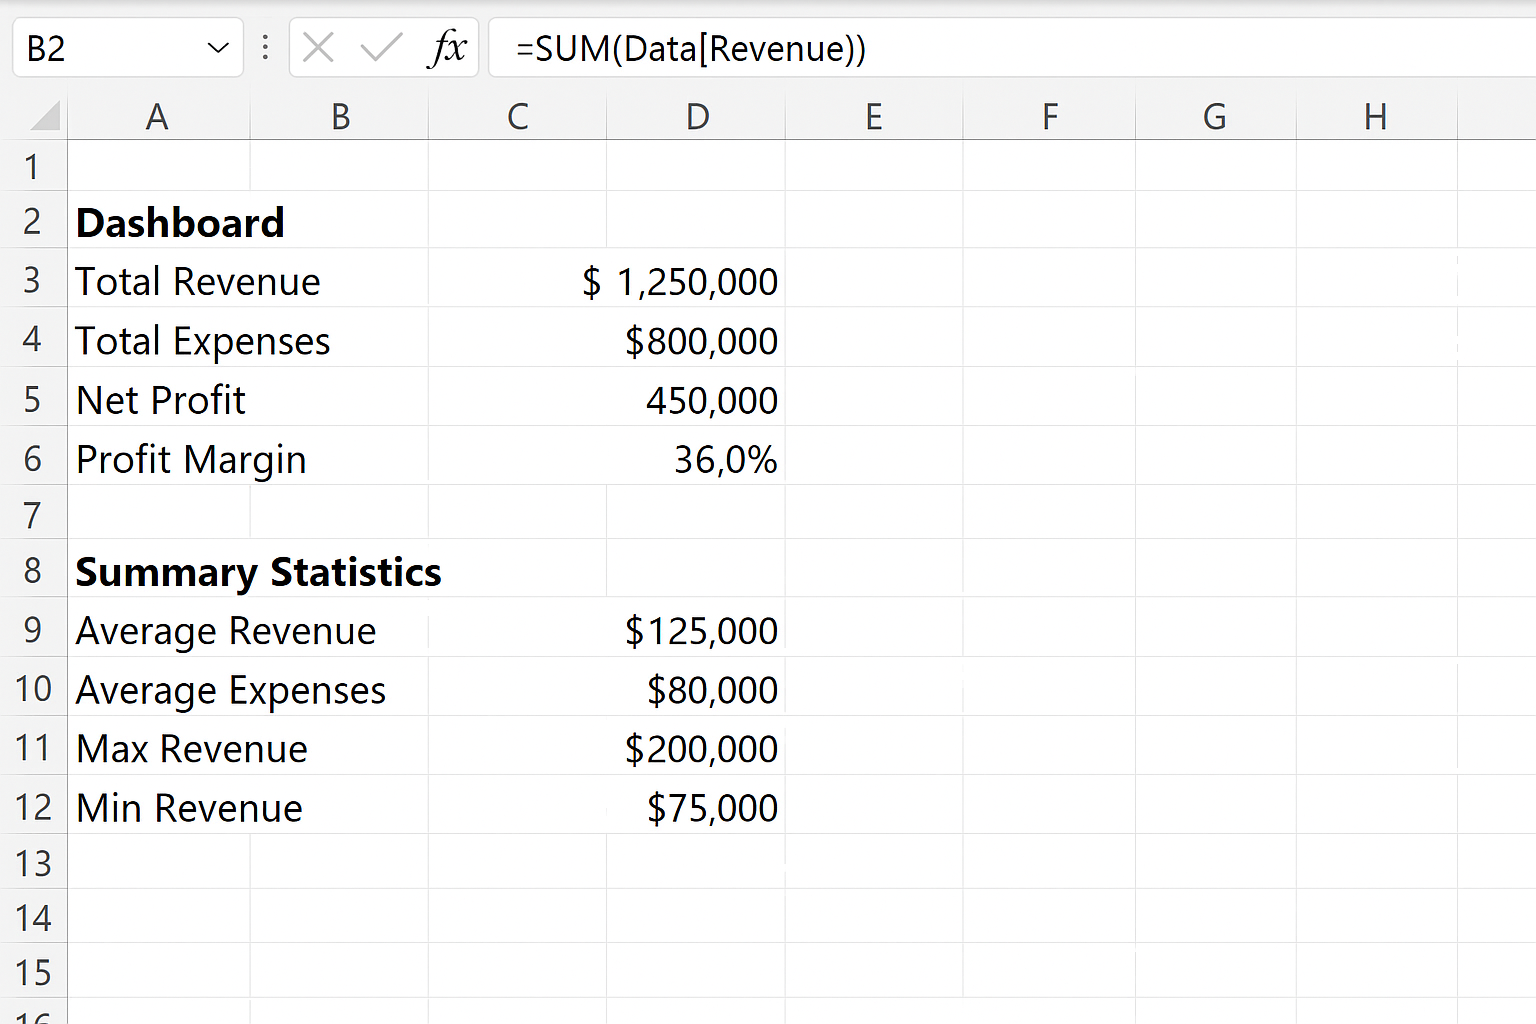
- Action Step: On the Dashboard sheet, link cells to summary metrics (e.g., total sales) using formulas like
=SUM(Data[Revenue]).
- Action Step: On the Dashboard sheet, link cells to summary metrics (e.g., total sales) using formulas like
-
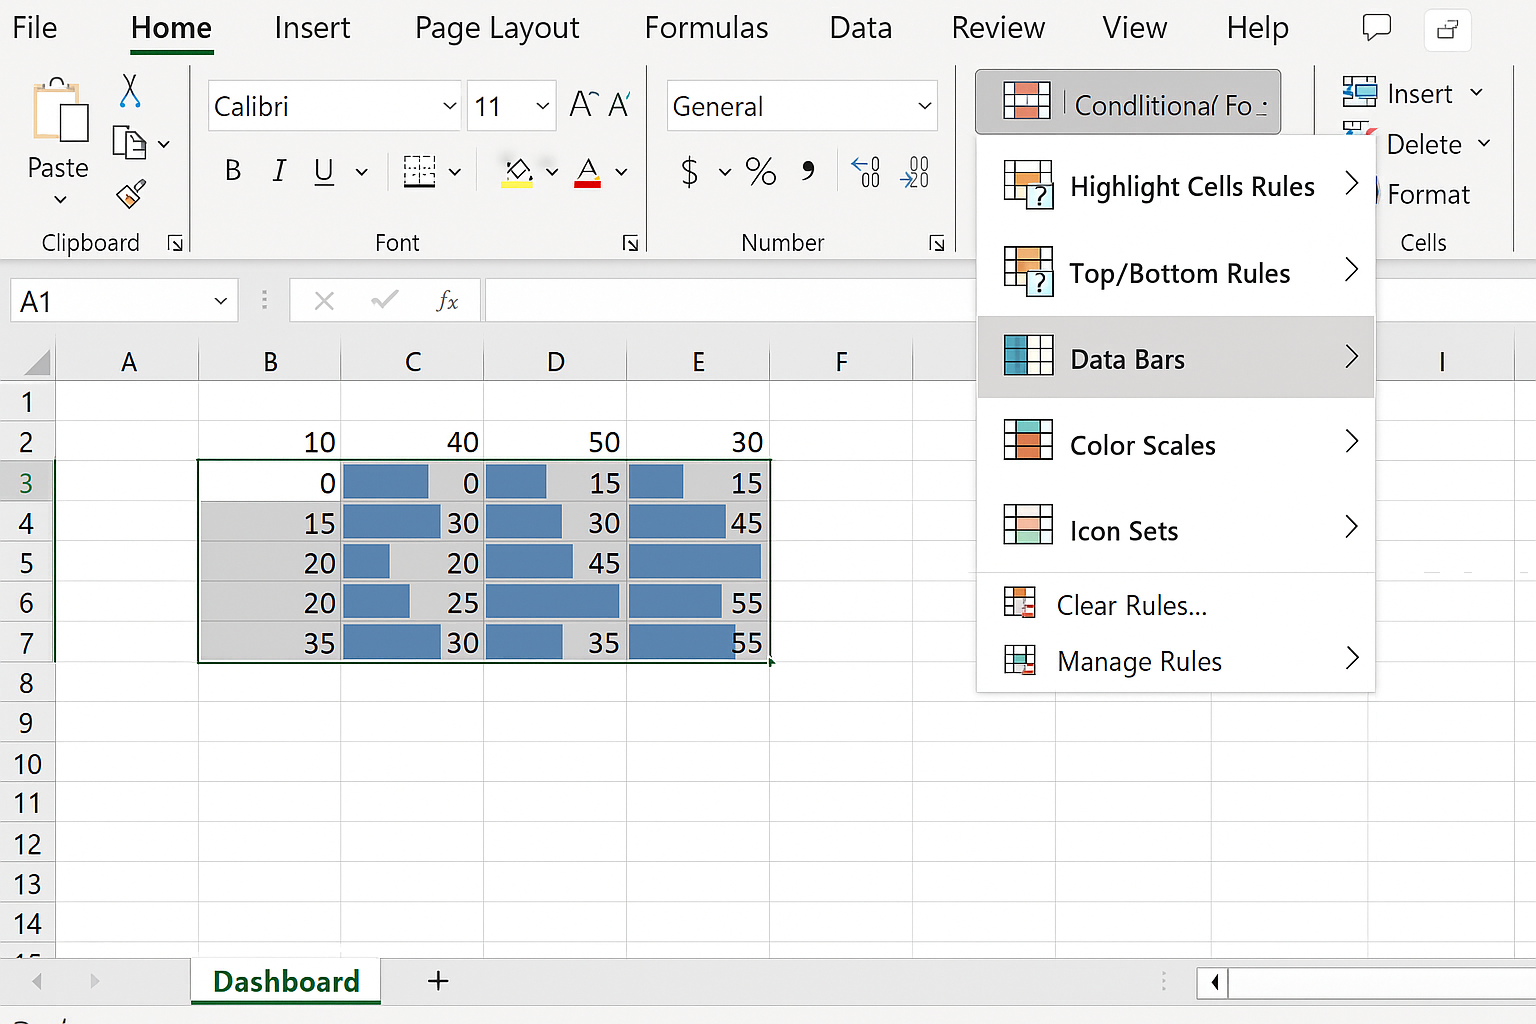
- Select these cells, then go to Home > Conditional Formatting and choose rules such as “Data Bars” or “Color Scales” to visually emphasize performance.
Step 8: Make It User-Friendly
Ensure your dashboard is easy to navigate and interpret.
- Use clear labels and tooltips where possible.
- Lock or hide unnecessary sheets or cells (Review > Protect Sheet) to prevent accidental edits.
- Test slicers and filters to confirm they update charts correctly.
Example: Creating a Sales Dashboard to Build Excel Dashboards
Let’s build a simple sales dashboard step by step:
- Import Data: Paste sales data into a sheet named Data.
- Convert to Table: Select data and press Ctrl + T.
- Create Pivot Table: Insert a pivot table to summarize sales by Region and Month.
- Insert Charts: Create a line chart for monthly sales trends and a bar chart for sales by region.
- Add Slicers: Add slicers for Product and Region for interactive filtering.
- Design Layout: Arrange all elements neatly on the Dashboard sheet.
- Highlight KPIs: Add total sales with conditional formatting.
Conclusion
Building Excel dashboards that impress stakeholders is about combining clear data presentation with interactive features. By planning your dashboard, organizing data properly, using pivot tables and charts, and designing with the end user in mind, you can create insightful dashboards that drive informed decisions. Practice these steps and customize them to fit your specific needs to deliver powerful Excel dashboards every time.
Frequently Asked Questions
- What is the best chart type for Excel dashboards? The best chart depends on your data and what you want to communicate. Bar and column charts are great for comparisons, line charts for trends over time, and pie charts for part-to-whole relationships.
- How do I keep my dashboard updated with new data? Use Excel Tables for your data source and pivot tables linked to these tables. When you add new data to the table, refresh your pivot tables and charts to update the dashboard.
- Can I make Excel dashboards interactive? Yes, by using slicers, timelines, and form controls, you can allow users to filter and explore data dynamically.
- Is it possible to share dashboards with stakeholders who don’t have Excel? You can export dashboards as PDFs or use Power BI for interactive dashboards accessible online. Alternatively, save Excel files to OneDrive and share links for viewing.
- How can I improve the performance of large Excel dashboards? Limit volatile functions, avoid excessive formatting, use efficient formulas, and keep data organized to help improve performance.