Mastering Data Transformation with Power Query: Step-by-Step Guide

Introduction
Power Query is an incredibly powerful tool embedded in Excel that enables users to efficiently extract, transform, and load data from multiple sources. It simplifies the process of cleaning and reshaping data, making it an essential skill for anyone working with large datasets. This article will guide you step-by-step through mastering Power Query data transformation techniques to enhance your data analysis capabilities.
What is Power Query Data Transformation?
Data transformation in Power Query involves modifying raw data into a more structured and useful format. This process includes tasks such as filtering rows, changing data types, merging tables, and pivoting data. Power Query automates these tasks with an intuitive interface and minimal need for coding.
Getting Started with Power Query
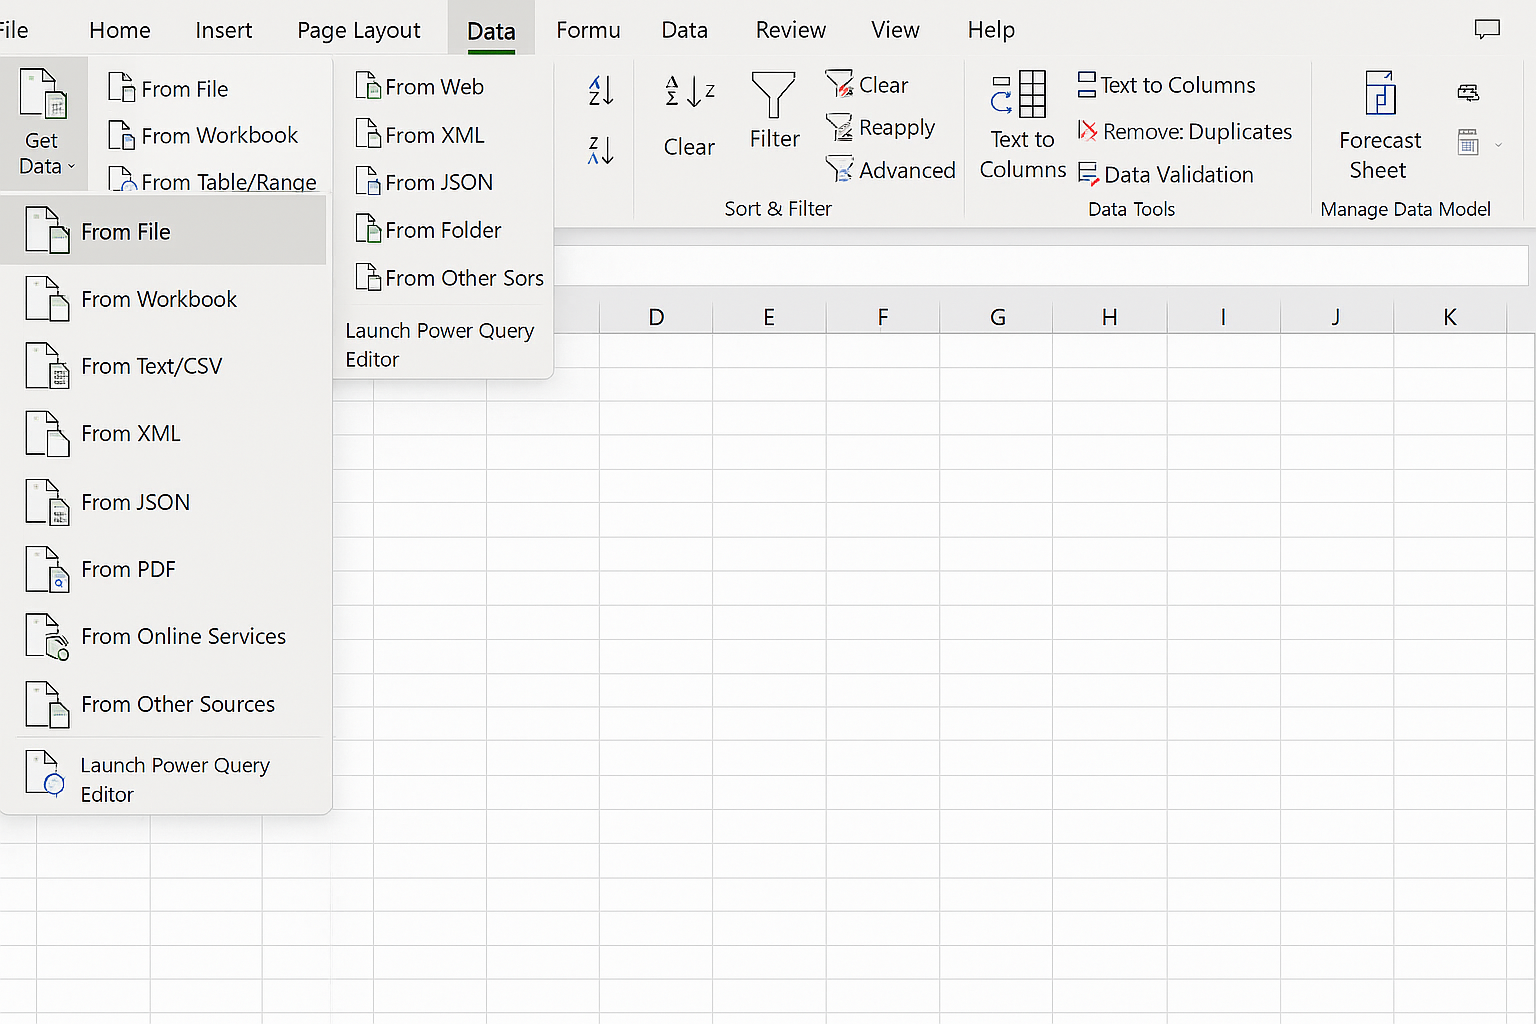
To begin, open Excel and navigate to the Data tab. Click on Get Data to import your dataset from various sources such as Excel files, CSVs, databases, or web data.
Once your data is loaded into the Power Query Editor, you can start applying transformations. Below are the most common and practical transformations you’ll use regularly.
Essential Power Query Data Transformation Techniques
1. Removing Unnecessary Columns
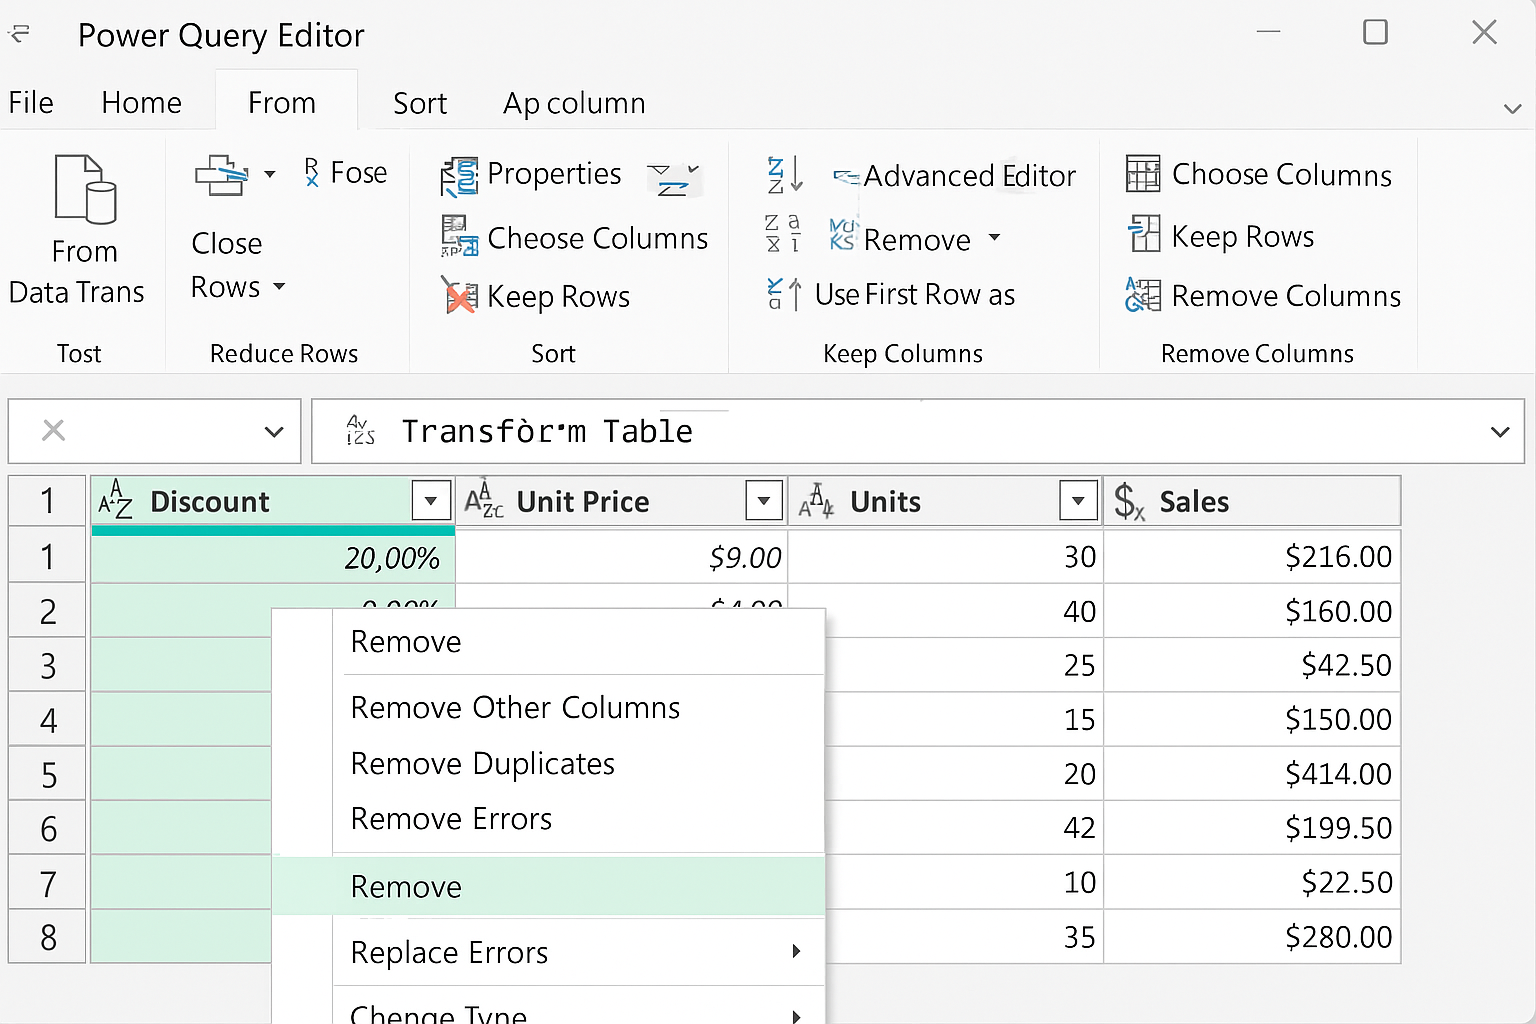
To focus on relevant data, remove columns that are not needed. Right-click the column header and select Remove or use the ribbon button Remove Columns. This declutters your dataset and improves processing speed.
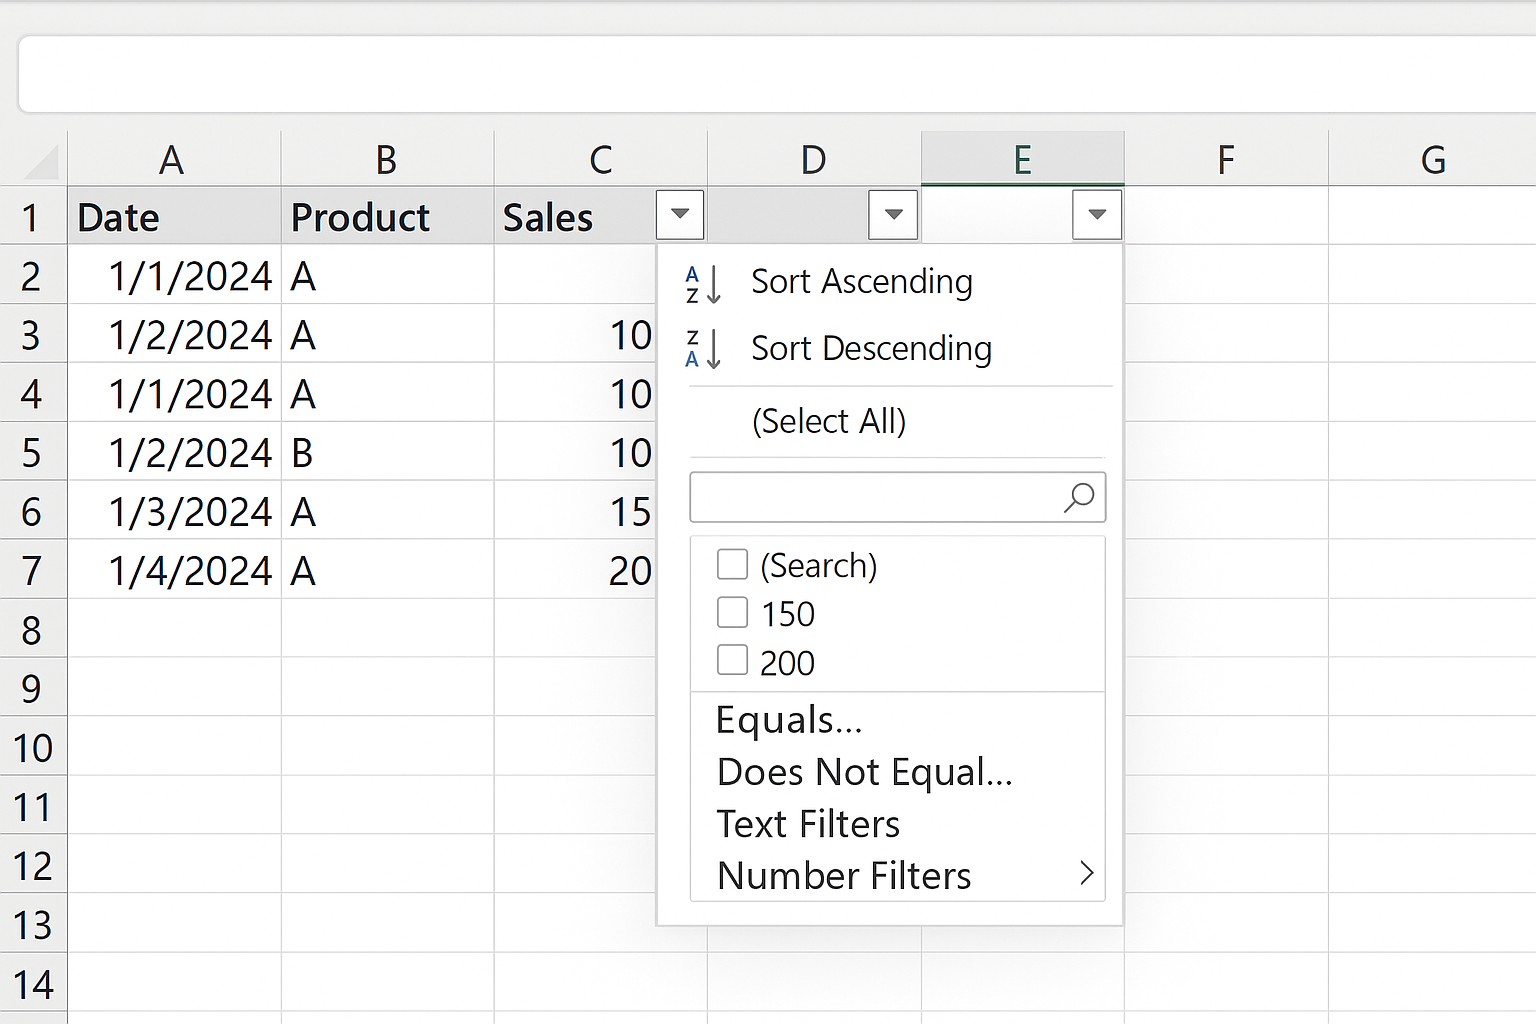
2. Filtering Rows
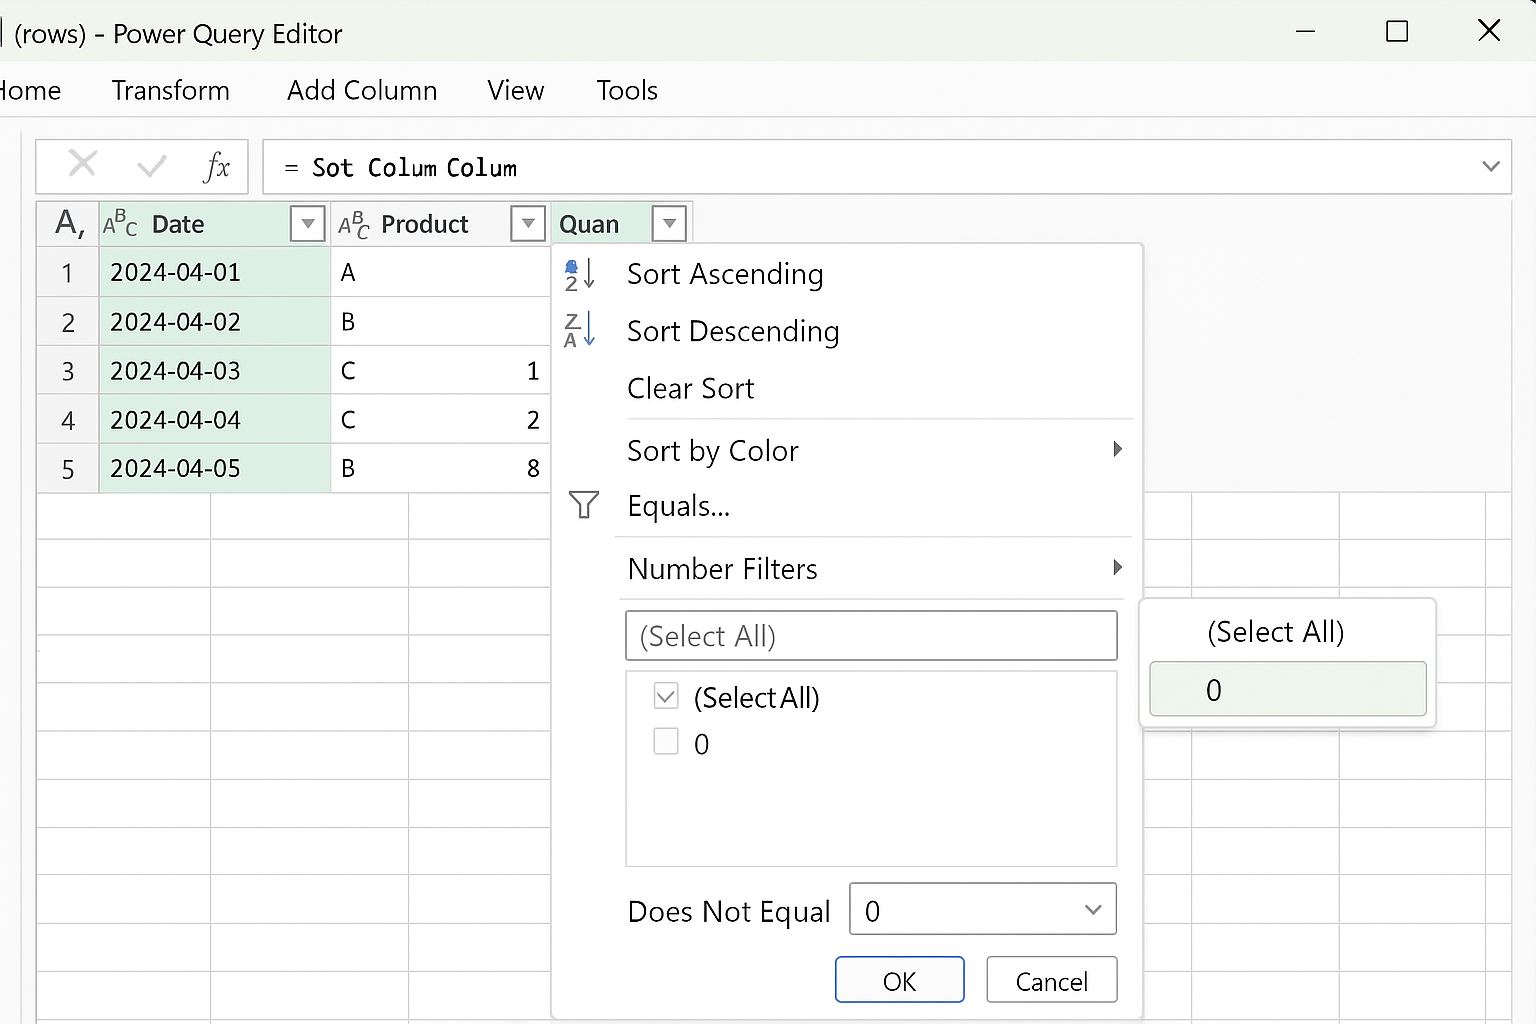
Filter rows to include or exclude data based on specific criteria. Click the dropdown arrow in the column header and select filter options such as Equals, Does Not Equal, or use text and number filters.
3. Changing Data Types
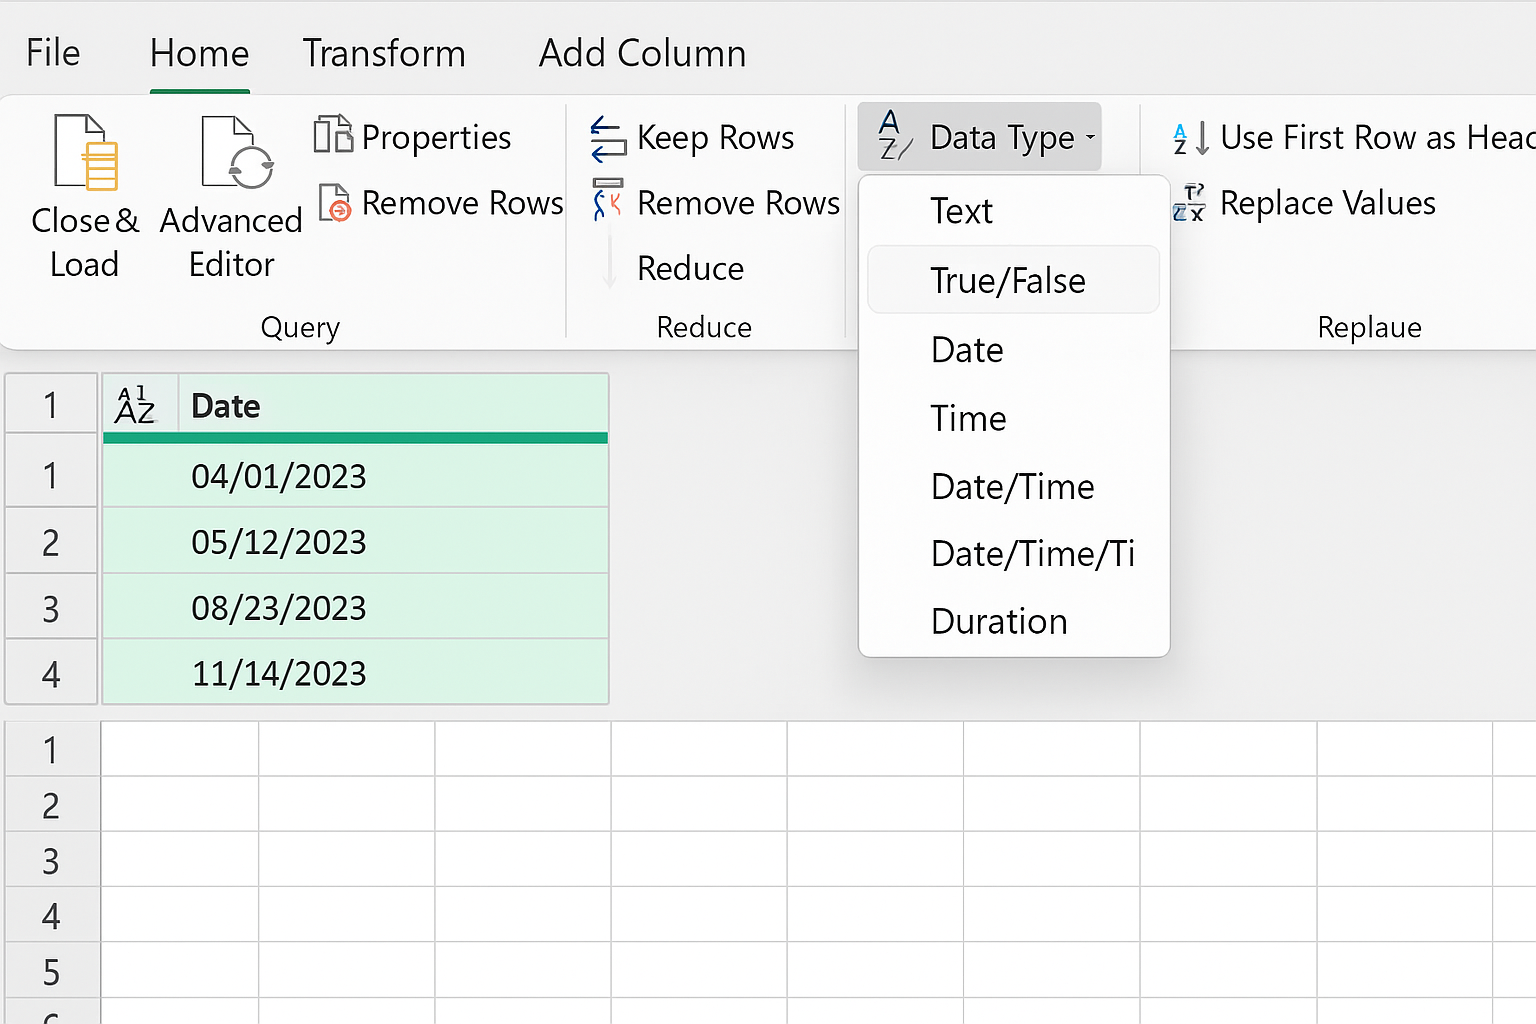
Correct data types ensure your data is interpreted accurately. Select a column, then use the Data Type dropdown in the toolbar to select types like Text, Number, Date, or Boolean.
4. Splitting Columns
Split a column into multiple columns based on delimiters (e.g., commas, spaces). Select the column, then go to Home > Split Column and choose the splitting method.
5. Merging Queries
Combine data from different tables by merging queries based on a common key. Use Home > Merge Queries, select the tables and matching columns, then choose the join type (Left, Right, Inner, Full).
6. Pivoting and Unpivoting Columns
Pivot transforms rows into columns to summarize data, while unpivot converts columns back into rows for normalized data. Right-click the column headers and select Pivot Column or Unpivot Columns.
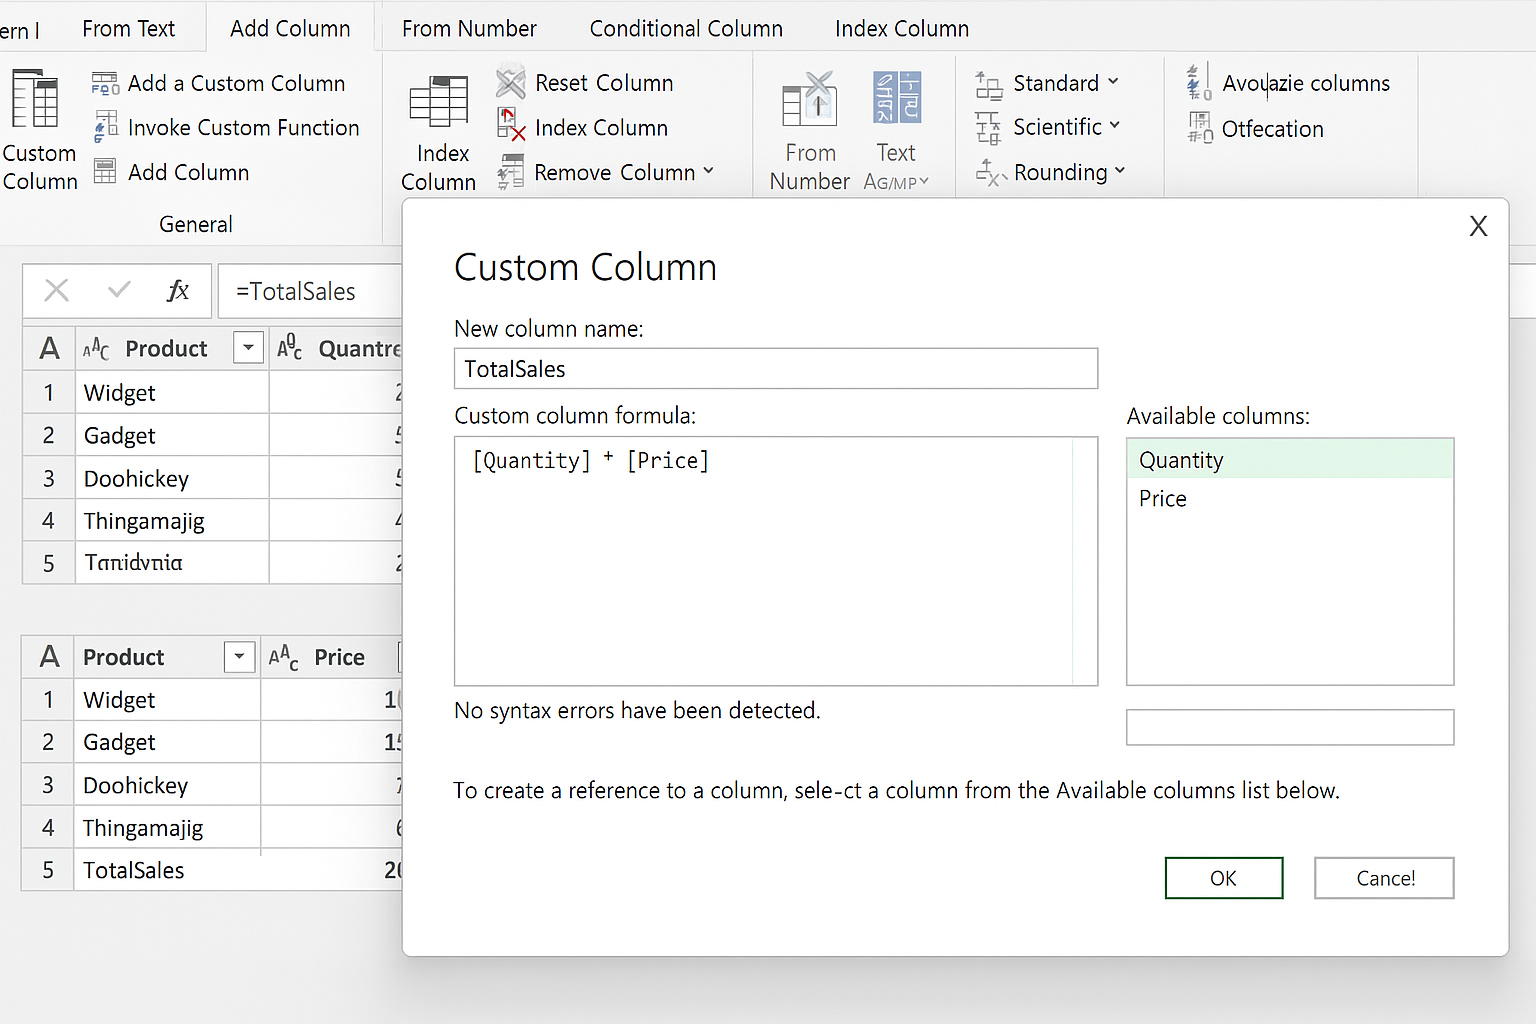
7. Adding Custom Columns
Create new columns with custom formulas using Power Query’s M language. Go to Add Column > Custom Column, then enter your formula. For example, = [Sales] * 1.1 to calculate a 10% sales increase.
Practical Example: Cleaning Sales Data
Imagine you have a raw sales dataset with columns: OrderID, Date, Customer, Product, Quantity, Price, Discount. You want to prepare this data for analysis by performing the following transformations:
- Remove the Discount column
- Filter out orders with zero quantity
- Change the Date column to Date type
- Calculate total sales per order by adding a custom column
TotalSales = Quantity * Price
Steps:
- Import your sales data into Power Query.
- Right-click the Discount column and select Remove.
- Filter the Quantity column to exclude rows where Quantity equals 0.
- Select the Date column, then set its data type to Date.
- Go to Add Column > Custom Column, name it TotalSales, and enter the formula:
[Quantity] * [Price].
After these steps, your data will be cleaner and more structured for further analysis or reporting.
Tips for Efficient Power Query Data Transformation
- Use Descriptive Step Names: Rename each transformation step for better readability and maintenance.
- Leverage Query Dependencies: Break complex transformations into multiple queries referencing each other for easier debugging.
- Refresh Queries Regularly: When source data updates, refresh queries to keep your reports accurate.
- Document Your Workflow: Keep notes on what each step does, especially for collaborative projects.
Conclusion
Mastering Power Query data transformation empowers you to turn messy raw data into insightful and well-organized information. With its user-friendly interface and powerful features, Power Query is indispensable for any Excel user looking to streamline data preparation and analysis. Practice these techniques regularly to enhance your data management skills and save valuable time.
Related Articles
- Power Query Tutorial: Getting Started with Data Transformation
- Understanding the Power Query Interface: A Beginner’s Guide
- How to Use Power Query in Excel for Efficient Data Cleaning
- Top 10 Excel Power Query Tips to Boost Your Data Analysis
- How to Merge Queries in Power Query for Advanced Data Analysis
Want practical Excel help?
Support free Excel tutorials, get weekly tips, or contact us for Excel programming, VBA, Power Query, dashboards, and automation work.