Mastering Excel Summary Reports: Formulas, Pivot Tables, and AI Automation

Introduction
Excel remains an essential tool for data analysis and reporting. When tasked with generating summary reports—whether for sales, inventory, or financial data—choosing the right method can dramatically affect your workflow’s efficiency and accuracy. This article explores three powerful approaches: formula-based solutions, pivot tables, and leveraging AI-powered automation within Excel to streamline your reporting process.
1. Creating Summary Reports Using Excel Formulas
Formula-based summary reports offer flexibility and dynamic updates. Some of the most useful formulas for report creation include UNIQUE, SUMIFS, and GROUPBY.
Step-by-Step: Using UNIQUE and SUMIFS
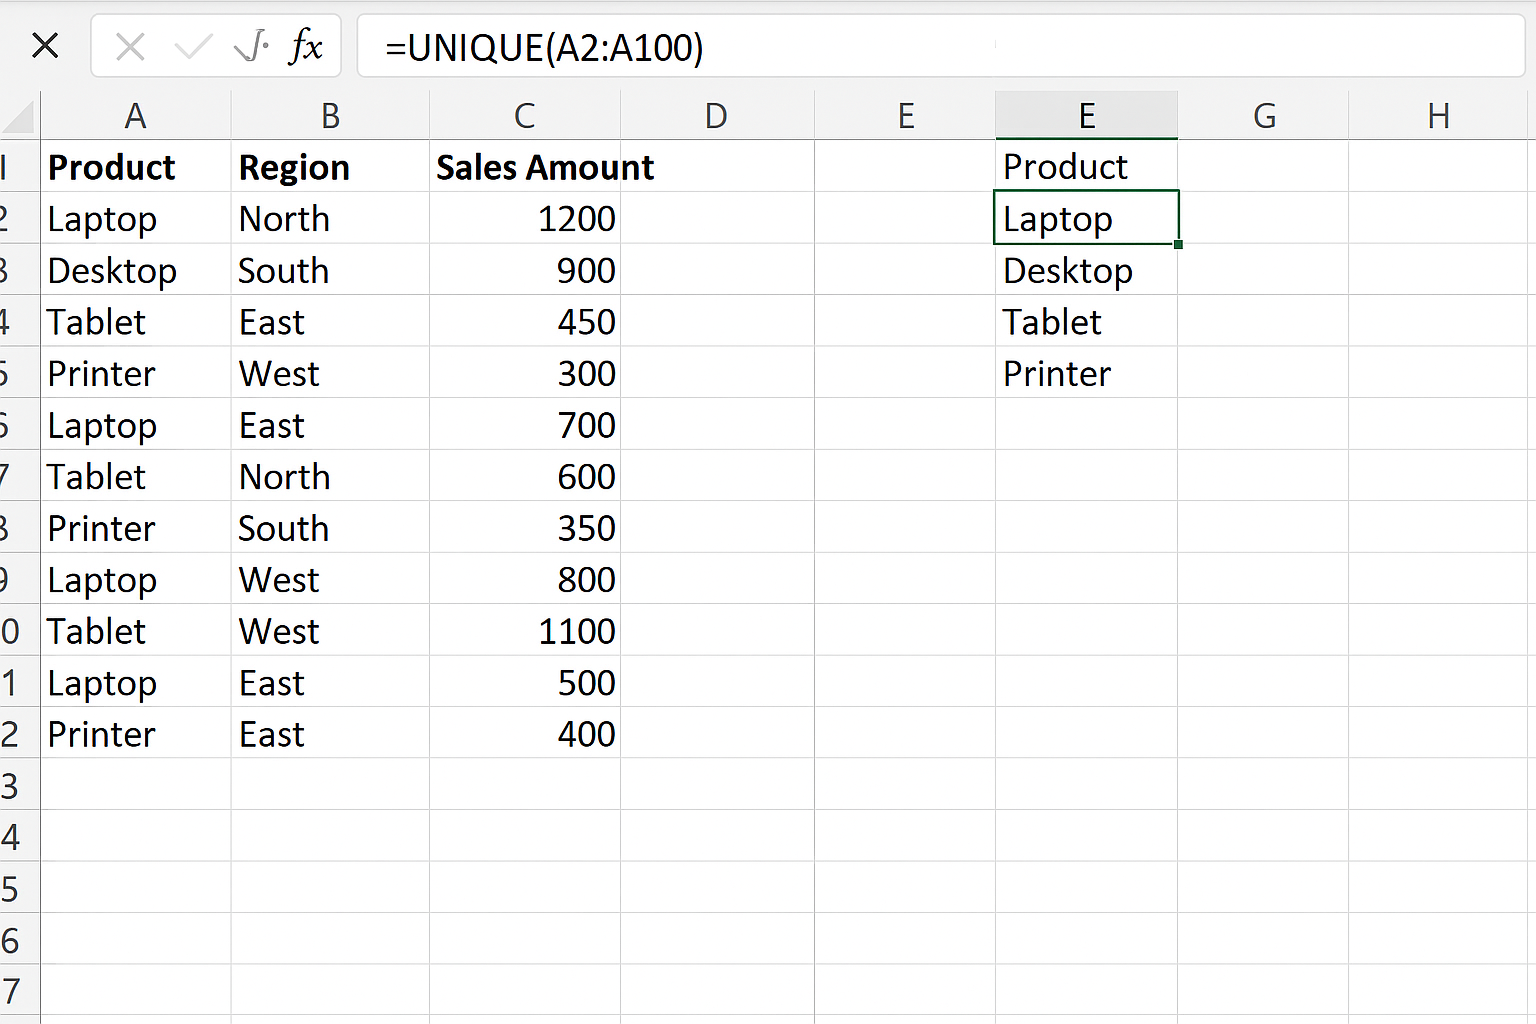
Imagine you have a dataset with sales records containing columns for Product, Region, and Sales Amount. You want a summary report that shows total sales per product.
-
- Extract unique products: In a new column, type
=UNIQUE(A2:A100)whereA2:A100is the product list.
- Extract unique products: In a new column, type
-
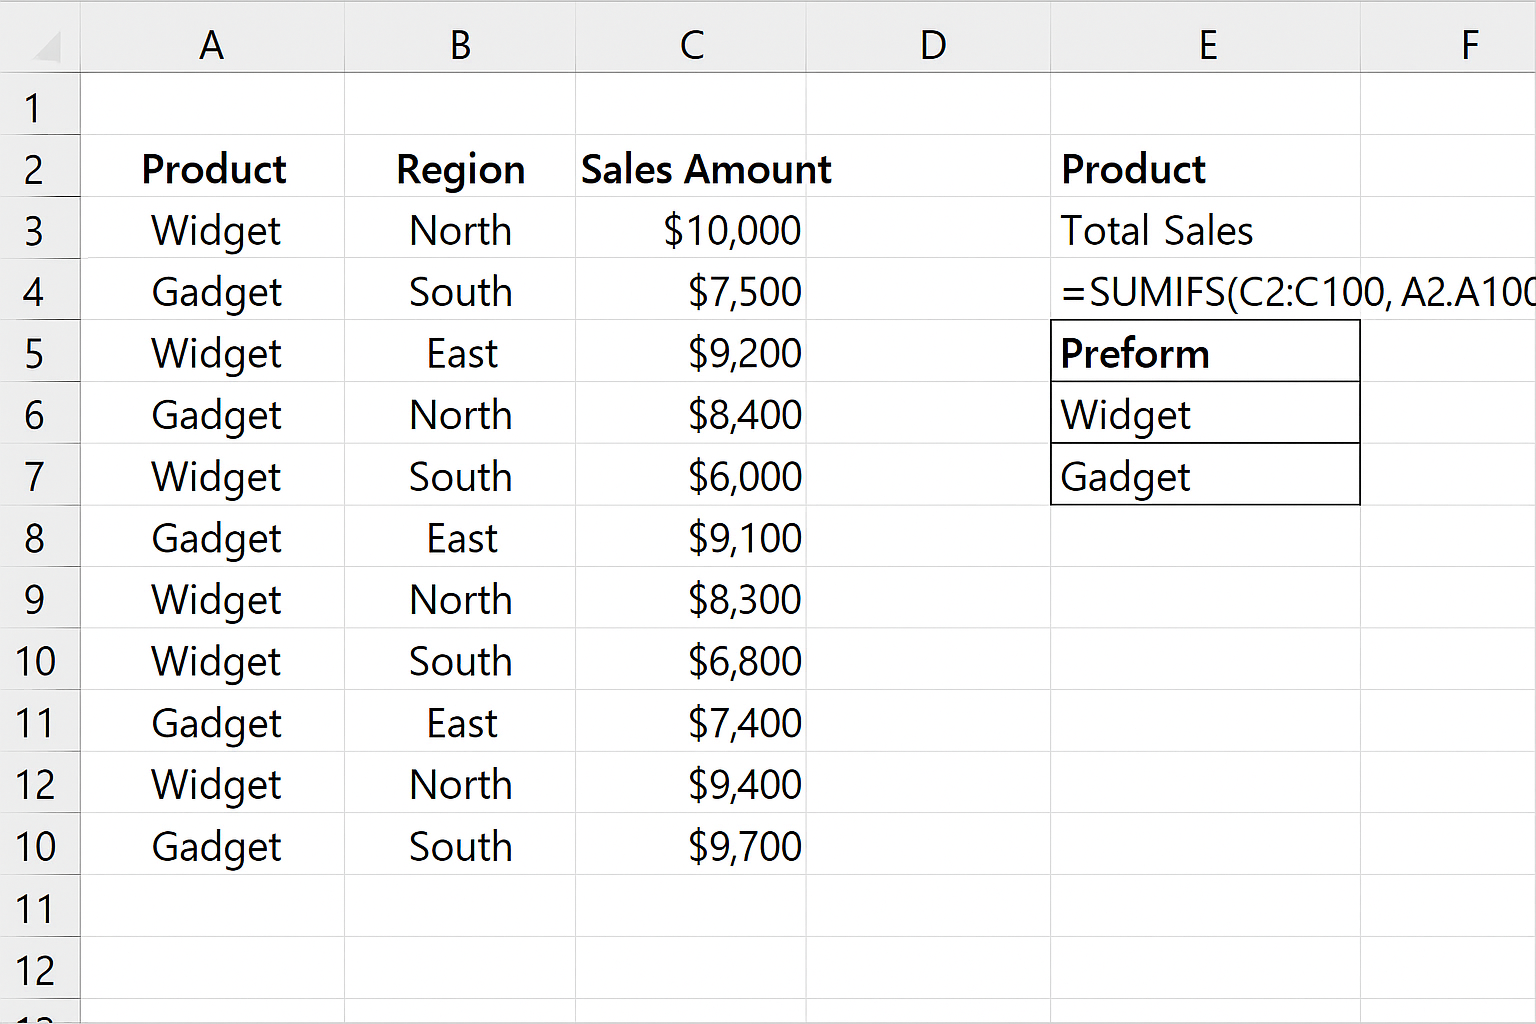
- Calculate total sales per product: Next to each unique product, enter
=SUMIFS(C2:C100, A2:A100, E2). Here,C2:C100is the sales amount range andE2is the cell with the unique product name.
- Calculate total sales per product: Next to each unique product, enter
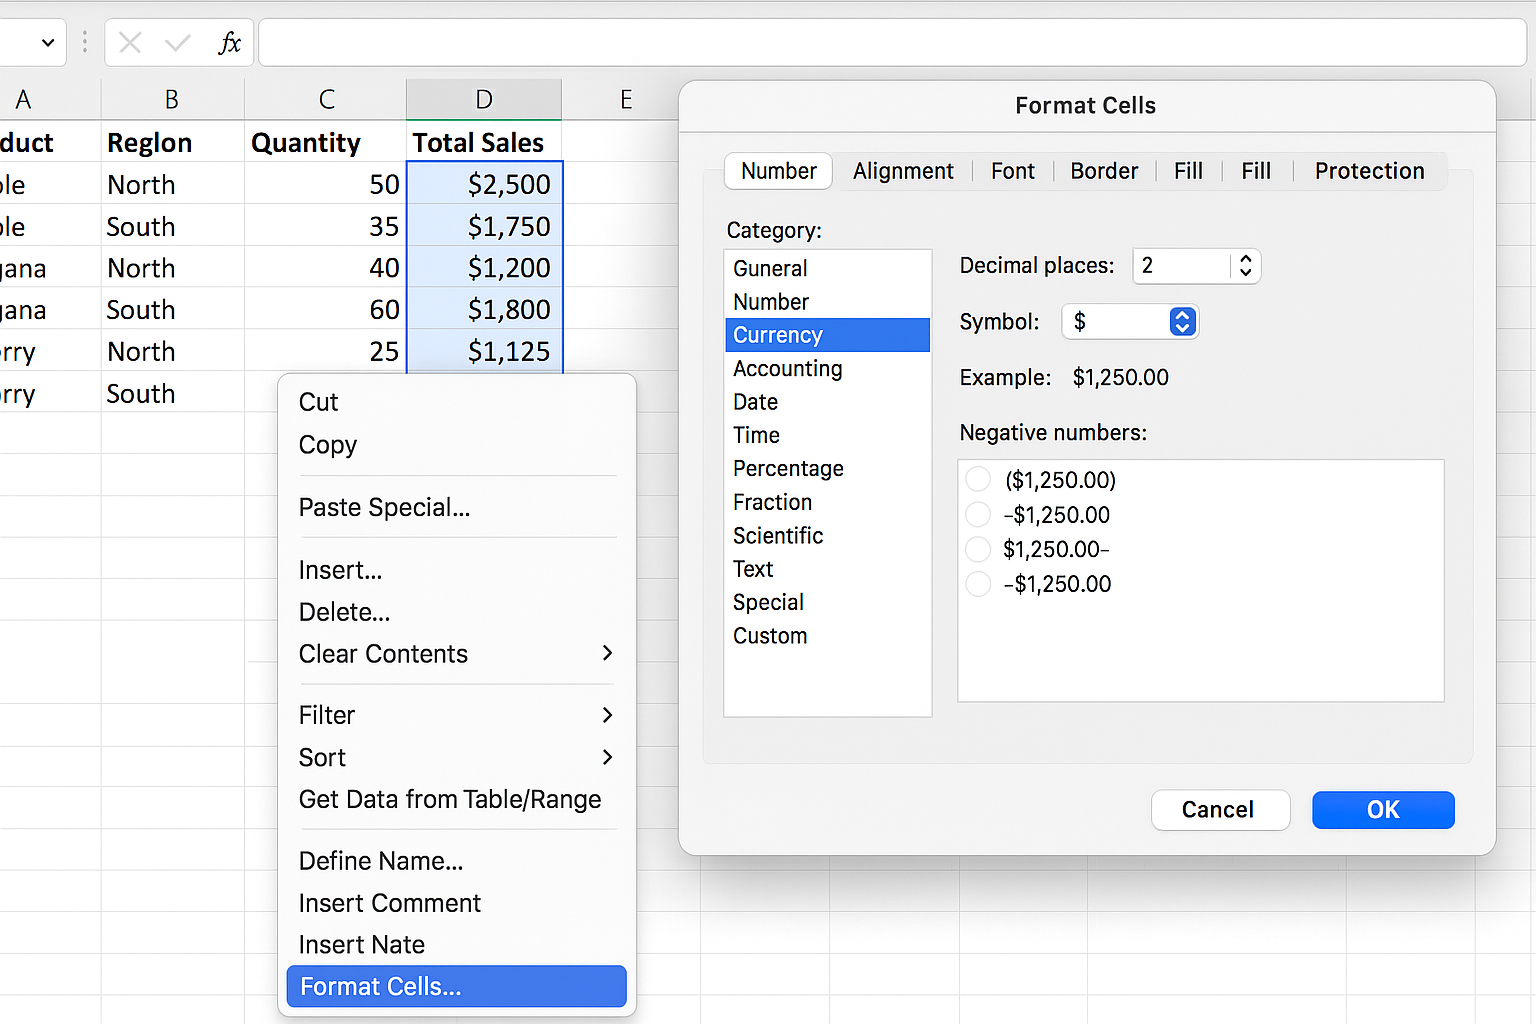
- Format the results: Select the total sales column, right-click, choose Format Cells, then select Currency.
Using the GROUPBY Function
If you are using Excel 365 or Excel 2021, the GROUPBY function can aggregate data in-place without creating pivot tables:
=GROUPBY(A2:C100, A2:A100, "Total Sales", SUMX(CURRENTGROUP(), C2:C100))
This formula groups data by product and sums sales directly.
2. Leveraging Pivot Tables for Summary Reporting
Pivot tables provide an intuitive way to summarize and analyze large datasets without writing complex formulas.
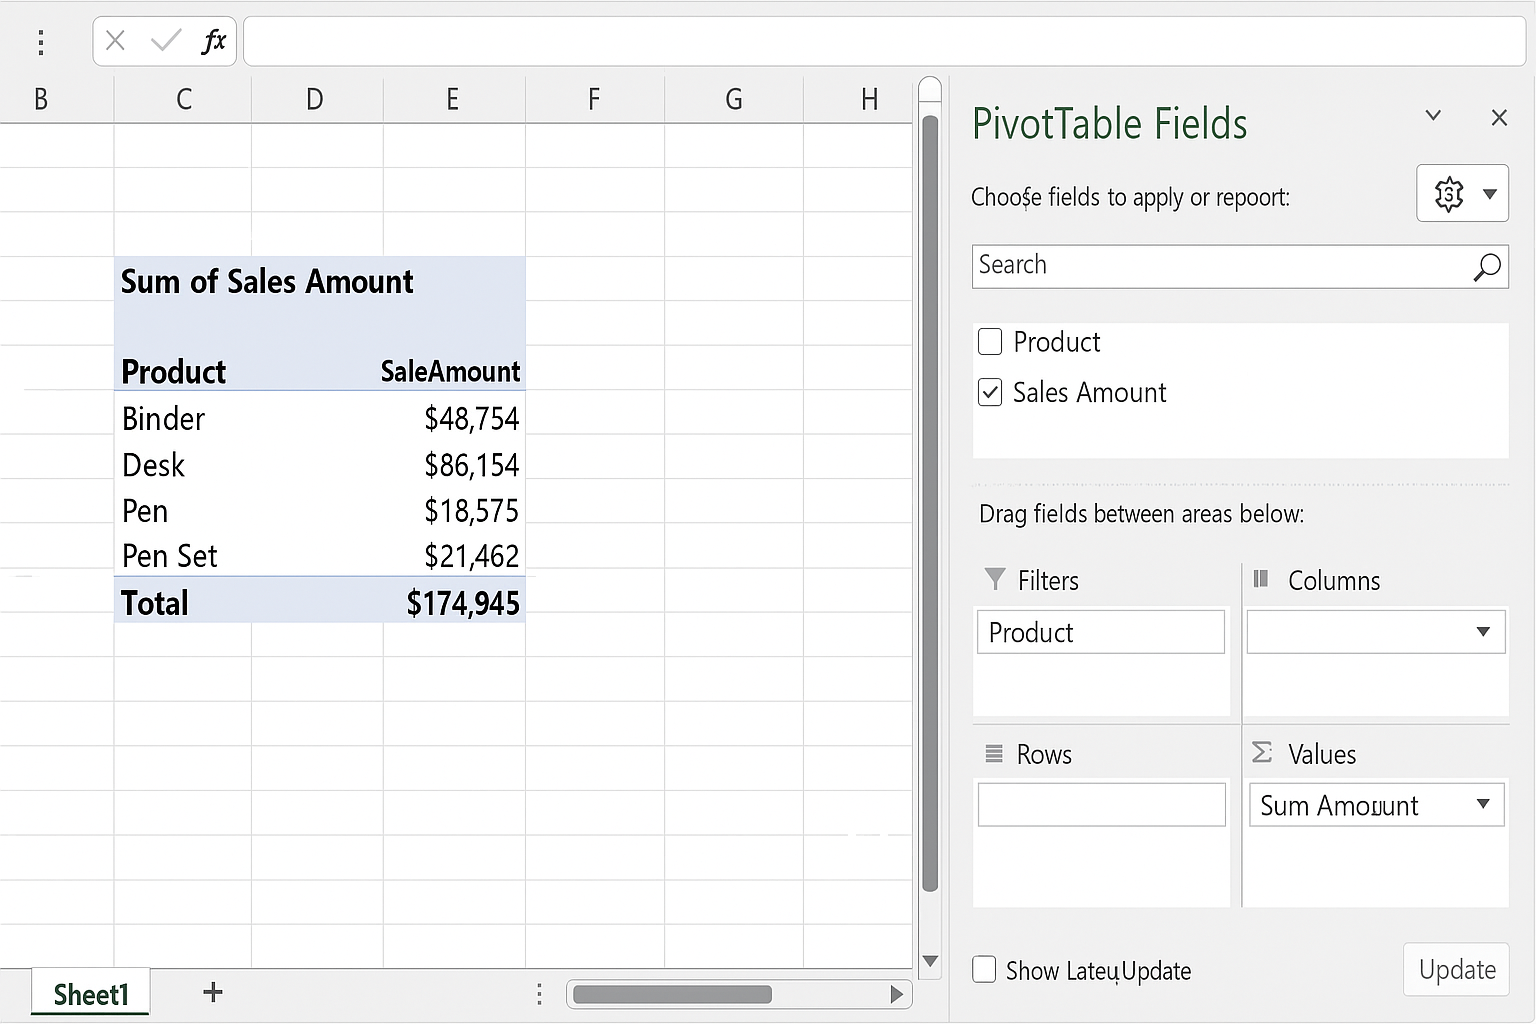
Step-by-Step: Creating a Pivot Table
-
- Select any cell in your dataset.
- Go to the Insert tab and click PivotTable.
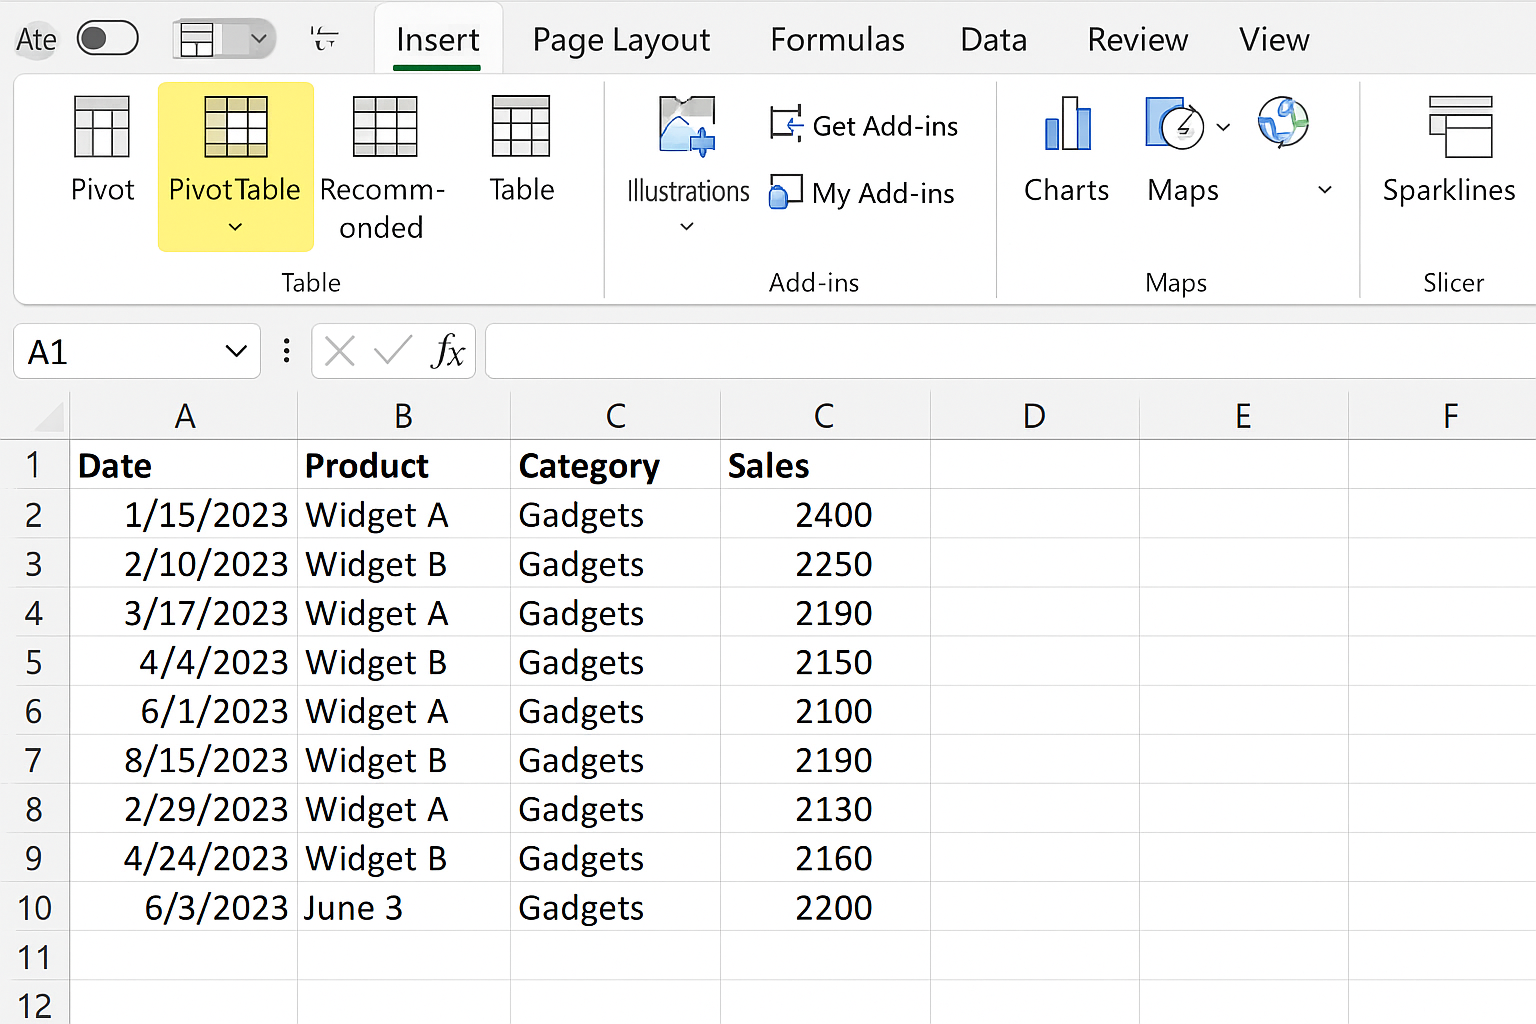
- In the dialog, confirm the data range and choose to place the pivot table in a new worksheet.
- Drag the Product field to the Rows area.
- Drag the Sales Amount field to the Values area. It will default to summing the sales.
- Optionally, drag Region to the Columns area to analyze sales by region.
Refreshing Pivot Tables
After updating your data, right-click inside the pivot table and select Refresh to update the summary.
3. Enhancing Summary Reporting with AI Automation in Excel
Excel now integrates AI-powered features such as Data Types, Ideas, and Power Query automation to simplify report generation and data transformation.
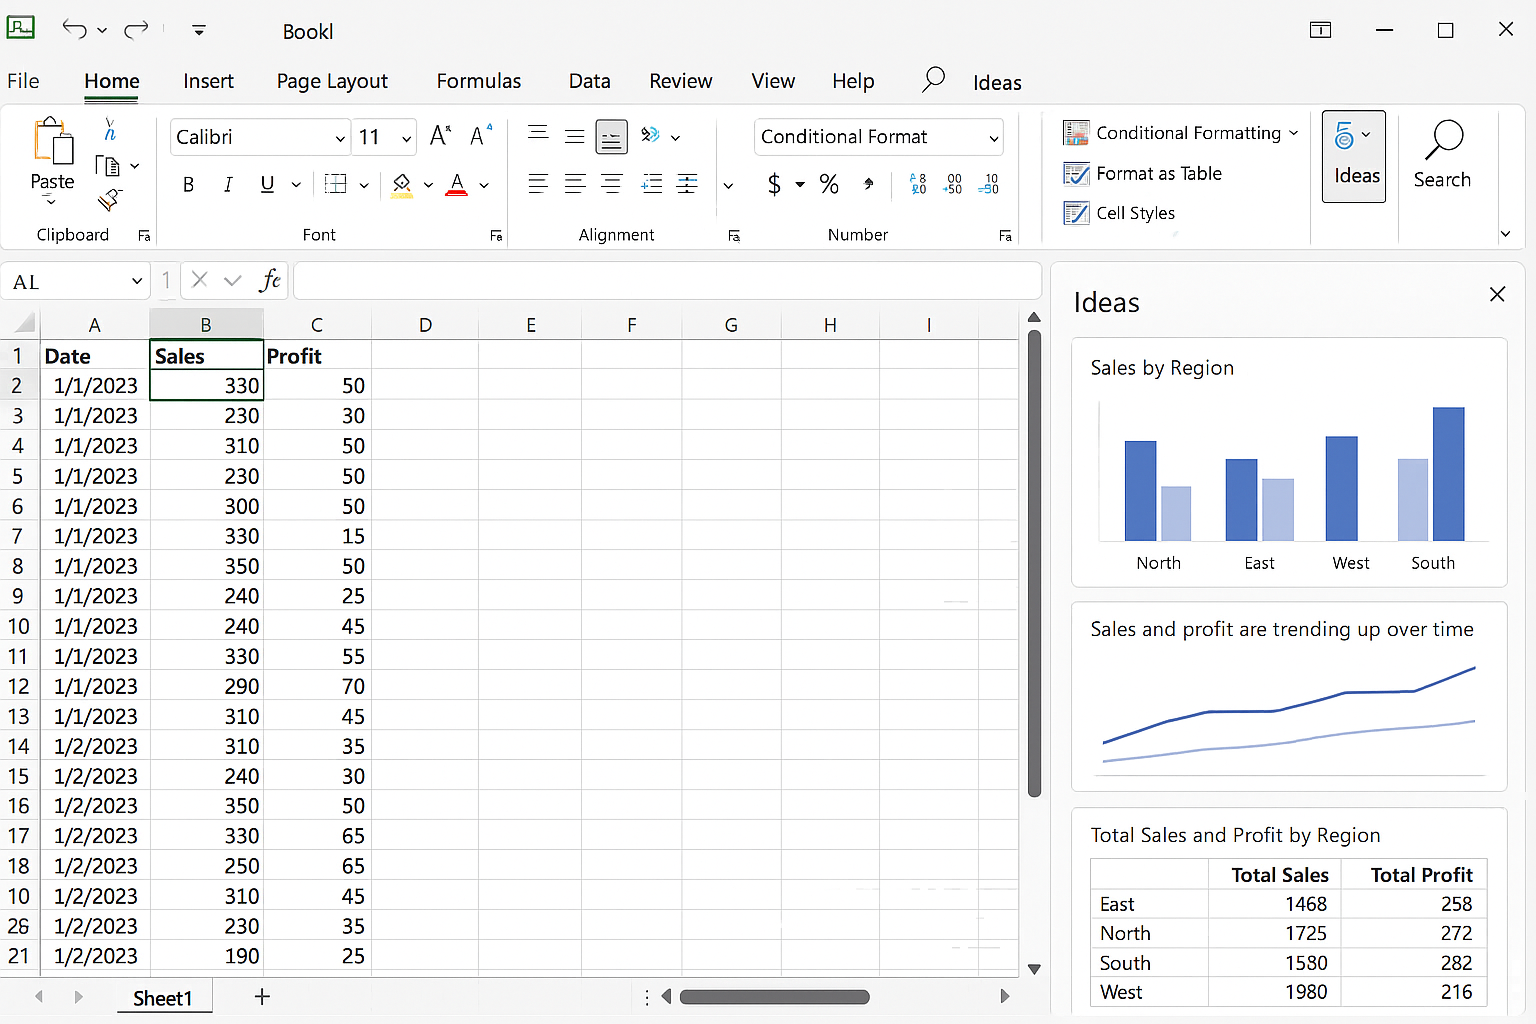
Using Ideas to Generate Insights
- Select your dataset.
- Navigate to the Home tab and click Ideas on the right side.
- Excel’s AI will analyze your data and provide suggested charts, trends, or summary tables.
Automating Data Preparation with Power Query
Power Query enables you to import, clean, and transform data automatically before building your report.
- Go to the Data tab and select Get Data > From File > From Workbook to load data.
- Use Power Query’s interface to filter rows, rename columns, or merge tables.
- Click Close & Load to output the clean data to Excel, ready for reporting.
Practical Example: Monthly Sales Summary
Suppose you receive monthly sales data from various branches. Here’s how to quickly build a summary report:
- Import data via Power Query to unify formats.
- Use a pivot table to summarize total monthly sales by branch.
- Apply conditional formatting to highlight top-performing branches: Select the sales column in the pivot table, go to Home > Conditional Formatting > Top/Bottom Rules > Top 10 Items, and adjust as needed.
- Use Excel’s AI Ideas to detect trends or anomalies in sales.
FAQs
Q1: When should I use formulas instead of pivot tables for summary reports?
Use formulas when you want dynamic, customizable calculations embedded in the worksheet or when you need to combine data in ways pivot tables don’t directly support.
Q2: Can AI features replace manual reporting in Excel?
AI features can accelerate data insights and automate routine tasks, but complex analysis still benefits from human guidance and formula customization.
Q3: How do I keep pivot tables updated with new data?
After adding data, right-click the pivot table and select Refresh. For automatic updates, consider using tables as data sources.
Q4: What are the advantages of Power Query in reporting?
Power Query streamlines data import, cleaning, and transformation, reducing manual errors and saving time before report creation.
Q5: Can I combine formulas and pivot tables in one report?
Yes, you can use formulas to manipulate or extend pivot table results for customized analysis or formatting.
Conclusion
Creating efficient Excel summary reports is possible through formulas, pivot tables, or AI-enabled automation, each suited for different scenarios. Mastering these methods empowers you to analyze data faster, improve accuracy, and boost productivity. By combining these tools thoughtfully, you can build powerful, adaptable reports that meet your business’s evolving needs.
Want practical Excel help?
Support free Excel tutorials, get weekly tips, or contact us for Excel programming, VBA, Power Query, dashboards, and automation work.