Cleaning Your Data: Best Practices Before Using Pivot Tables
Introduction
Pivot tables are one of Excel’s most powerful features, allowing users to summarize, analyze, and present large datasets quickly. However, the accuracy and usefulness of pivot tables depend heavily on the quality of the data they process. Cleaning your data before creating pivot tables is essential to avoid errors, inconsistencies, and misleading insights.
In this comprehensive article, we will explore the best practices to clean data for pivot tables, including how to identify common data issues, practical cleaning techniques, and tips for preparing your data to maximize pivot table efficiency.
Why Clean Data Is Crucial for Pivot Tables
Pivot tables work by grouping and aggregating data. If your dataset contains errors such as duplicates, blanks, inconsistent formatting, or mixed data types, the pivot table will produce inaccurate or confusing results. Here are key reasons why data cleaning is necessary:
- Accuracy: Ensures the summaries and counts reflect real information.
- Consistency: Helps categorize similar data points correctly.
- Performance: Reduces unnecessary data, making pivot tables faster.
- Readability: Clean data aids in creating understandable reports.
Common Data Problems Before Using Pivot Tables
Before diving into the cleaning process, it’s important to recognize typical data issues:
- Empty or Missing Values: Blank cells can distort aggregation.
- Duplicates: Repeated entries can inflate counts or sums.
- Inconsistent Formatting: Dates stored as text, mixed number formats.
- Mixed Data Types: Numbers and text combined within a column.
- Trailing Spaces or Extra Characters: Spaces or hidden characters affecting grouping.
- Incorrect Data Entries: Typos or invalid data points.
Step-by-Step Guide to Cleaning Data for Pivot Tables
1. Remove Duplicates
Duplicates can cause inflated counts and sums. To remove duplicates in Excel:
- Select your dataset.
- Navigate to the Data tab and click Remove Duplicates.
- Choose the columns to check for duplicates and confirm.
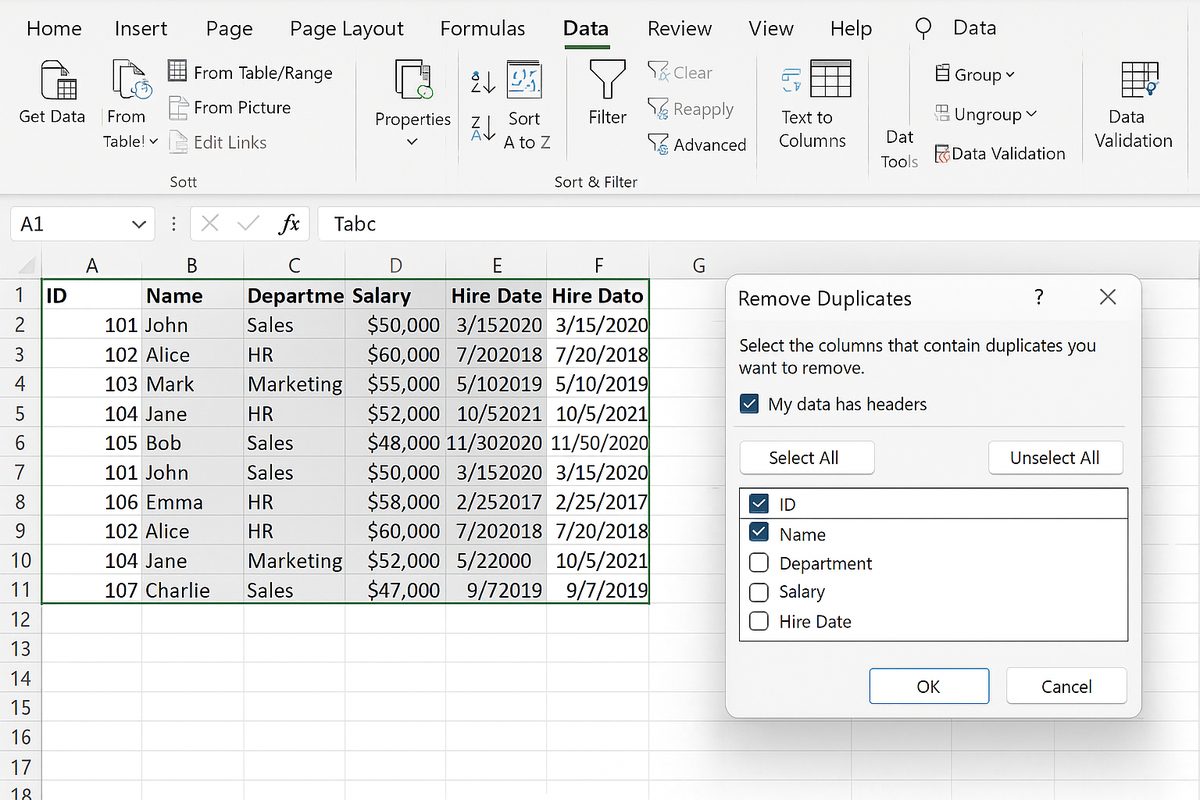
Example: In a sales dataset, a transaction recorded twice will double the revenue if duplicates are not removed.
2. Handle Missing or Blank Cells
Missing data can lead to inaccurate summaries. Depending on the context, you can:
- Fill blanks: Replace blanks with ‘N/A’, zero, or an average value.
- Filter out: Exclude rows with missing critical information.
Example: If a product category is missing, the pivot table cannot group sales properly.
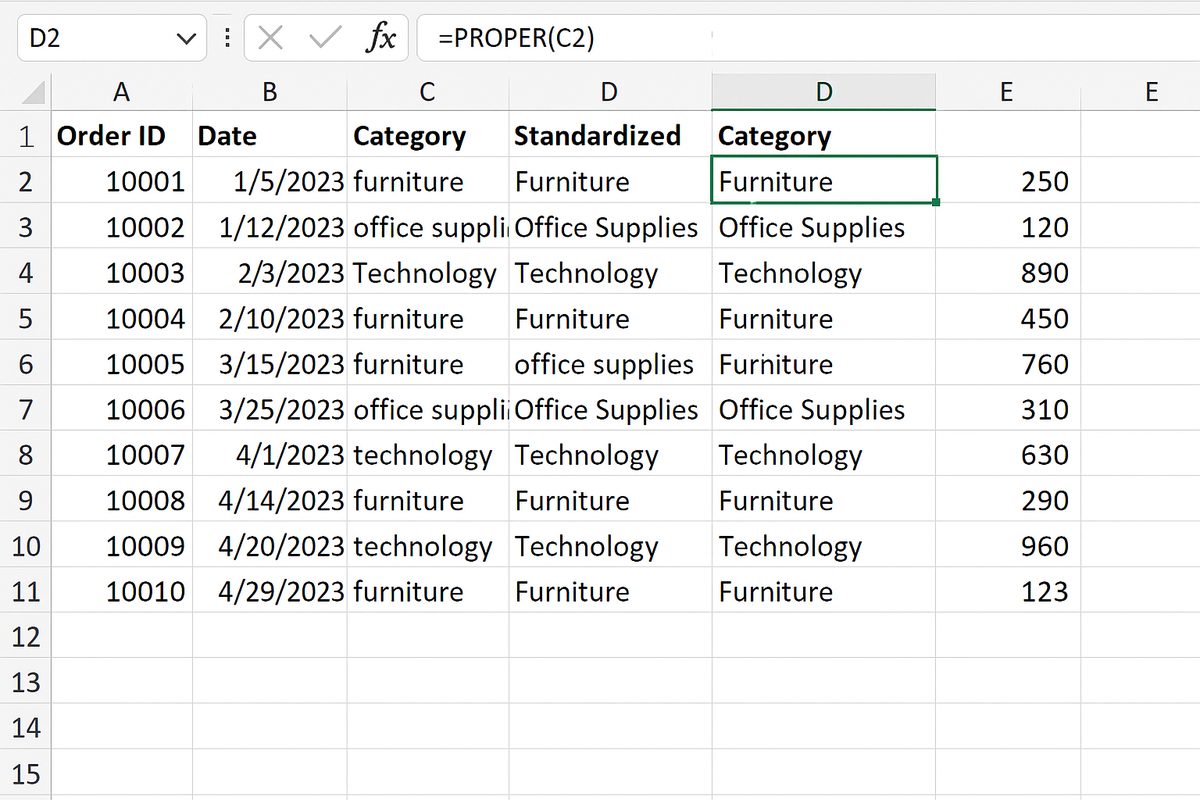
3. Standardize Formatting
Ensure data types are consistent:
- Dates: Convert text dates to proper date format using DATEVALUE or ‘Text to Columns’.
- Numbers: Make sure numbers are not stored as text.
Example: A date stored as text won’t group correctly by month or year in a pivot table.
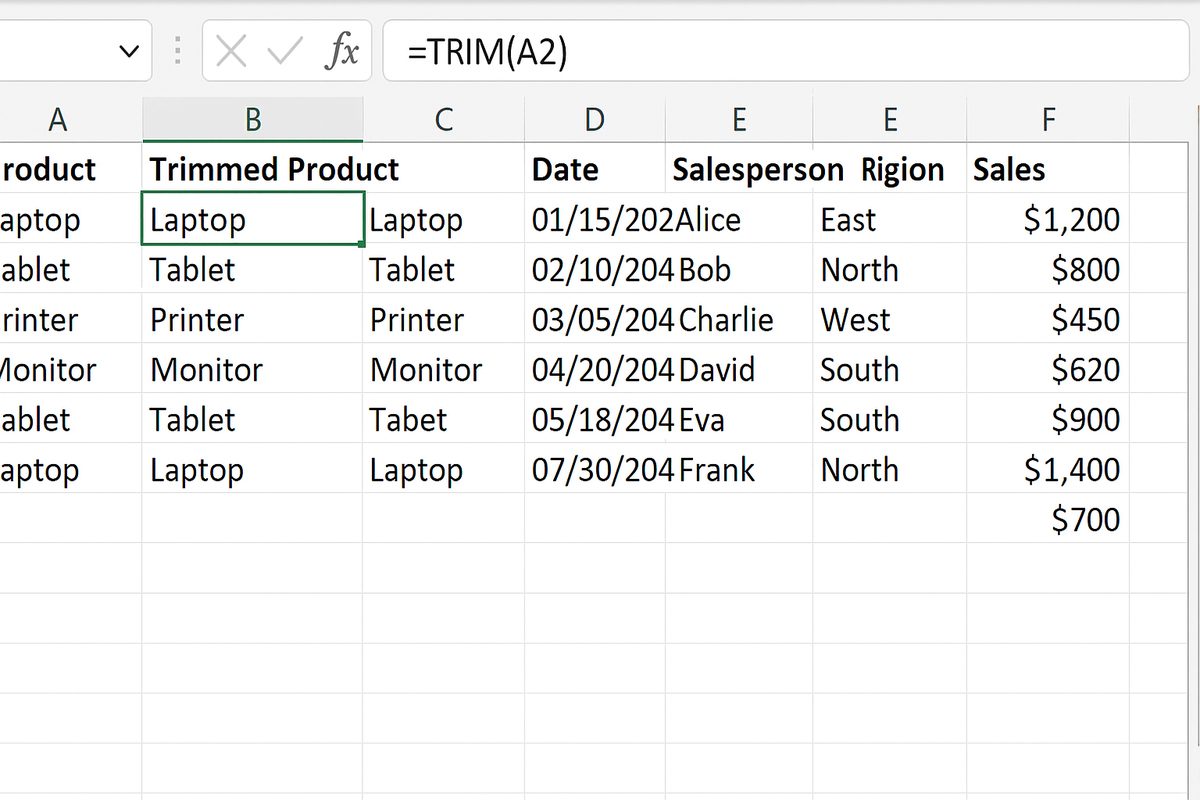
4. Trim Spaces and Remove Extra Characters
Leading/trailing spaces or hidden characters can cause Excel to treat similar entries as different. Use the TRIM function:
=TRIM(A2)
to clean text entries.
5. Correct Data Entry Errors
Review columns for typos or inconsistent naming conventions, such as ‘NY’ vs ‘New York’. Use Find and Replace or Data Validation to standardize entries.
6. Use Excel Tables for Dynamic Ranges
Convert your dataset into an Excel Table (Insert > Table). This ensures your pivot table references automatically adjust when you add or remove data.
Practical Example: Cleaning a Sales Dataset
Imagine you have the following raw data:
| Order ID | Product | Category | Sales Date | Amount |
|---|---|---|---|---|
| 1001 | Widget A | Gadgets | 2023-01-05 | 250 |
| 1002 | Widget B | gadgets | 01/10/2023 | 150 |
| 1003 | Widget A | Gadgets | 2023/01/15 | 250 |
| 1003 | Widget A | Gadgets | 2023/01/15 | 250 |
| 1004 | Widget C | 15-Jan-2023 |
Issues:
- Trailing space in ‘Widget A ‘
- Inconsistent capitalization in ‘gadgets’ vs ‘Gadgets’
- Duplicate entry for Order ID 1003
- Empty Category for Order ID 1004
- Missing Amount for Order ID 1004
- Mixed date formats
Cleaning steps:
- Use TRIM() on the Product column to remove trailing spaces.
- Convert all Category entries to consistent case using =PROPER() function.
- Remove duplicate rows based on Order ID.
- Fill missing Category with ‘Unknown’ or investigate the missing data.
- Fill missing Amount with 0 or average sales amount.
- Standardize Sales Date format using DATEVALUE() or Text to Columns.
Tips for Maintaining Clean Data
- Use Data Validation: Prevent invalid entries by restricting input types.
- Regularly Audit Data: Periodically check for inconsistencies or errors.
- Educate Data Entry Personnel: Proper training reduces errors at the source.
- Automate Cleaning: Use Excel formulas or Power Query to automate repetitive cleaning tasks.
Conclusion
Cleaning your data before creating pivot tables is a critical step to ensure accurate, reliable, and insightful analysis. By removing duplicates, handling missing values, standardizing formatting, and correcting errors, you can maximize the power of pivot tables and make your Excel reports more effective. Following these best practices will save you time, improve data integrity, and help you unlock meaningful insights from your datasets.
Frequently Asked Questions
Related Articles
- Pivot Tables Tutorial: A Beginner’s Guide to Summarizing Data
- What Is a Pivot Table and How Can It Help You Analyze Data?
- How to Create a Pivot Table in Excel Step-by-Step
- Understanding Pivot Table Fields: Rows, Columns, Filters, and Values Explained
- Advanced Pivot Table Techniques to Master Data Analysis