Creating a Sales Report Using Pivot Tables in Excel

Introduction
Pivot tables are one of the most powerful tools in Microsoft Excel, enabling users to quickly summarize, analyze, and present complex datasets. When it comes to sales data, pivot tables provide a dynamic and insightful way to create detailed sales reports. In this article, we will guide you through creating a pivot table sales report in Excel, demonstrating practical steps and examples to help you unlock the full potential of your sales data.
What is a Pivot Table?
A pivot table is an interactive table that automatically extracts, organizes, and summarizes data from a larger dataset. It allows you to group data, calculate totals or averages, and filter results without changing the original data. Pivot tables are especially useful for sales reporting, as they can instantly break down sales figures by product, region, salesperson, time period, and more.
Step 1: Preparing Your Sales Data
Before creating a pivot table, make sure your sales data is well-organized in a tabular format. Each column should have a header, and there should be no blank rows or columns within the dataset. A typical sales dataset might include the following columns:
- Order Date
- Salesperson
- Region
- Product
- Units Sold
- Unit Price
- Total Sales (Units Sold × Unit Price)
For example:
| Order Date | Salesperson | Region | Product | Units Sold | Unit Price | Total Sales |
|---|---|---|---|---|---|---|
| 2024-01-15 | Jane Doe | North | Widget A | 10 | 15 | 150 |
| 2024-01-16 | John Smith | South | Widget B | 5 | 20 | 100 |
Step 2: Inserting a Pivot Table
1. Select any cell within your sales data table.
2. Go to the Insert tab on the Excel ribbon.
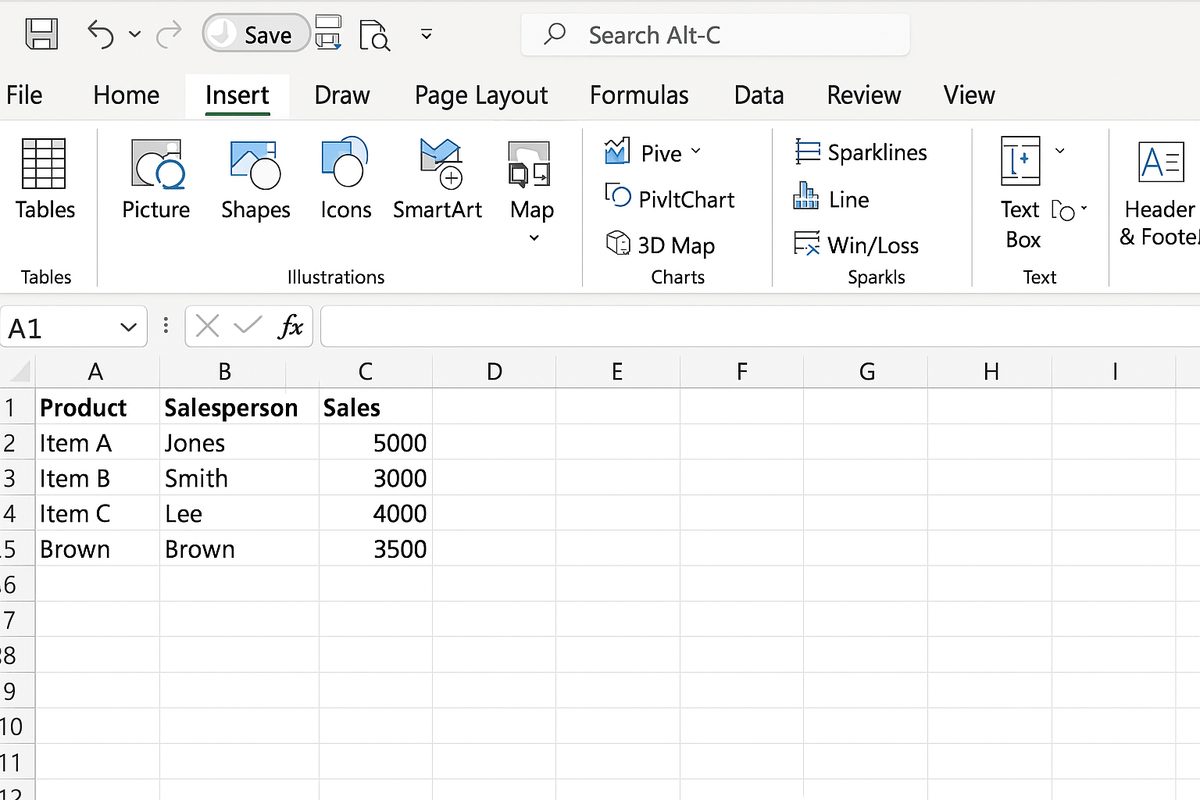
3. Click PivotTable. The Create PivotTable dialog box will appear.
4. Choose whether to place the pivot table in a new worksheet or an existing one.
5. Click OK.
Step 3: Building Your Pivot Table Sales Report
Now, the PivotTable Fields pane appears. Here’s how to organize fields for a comprehensive sales report:
- Rows: Drag the Salesperson and Product fields here to analyze sales by each salesperson and product.
- Columns: Drag the Region field to compare sales across different regions.
- Values: Drag the Total Sales field and ensure it is set to sum values (it usually defaults to sum).
- Filters: Optionally, drag the Order Date field here to filter the report by date ranges.
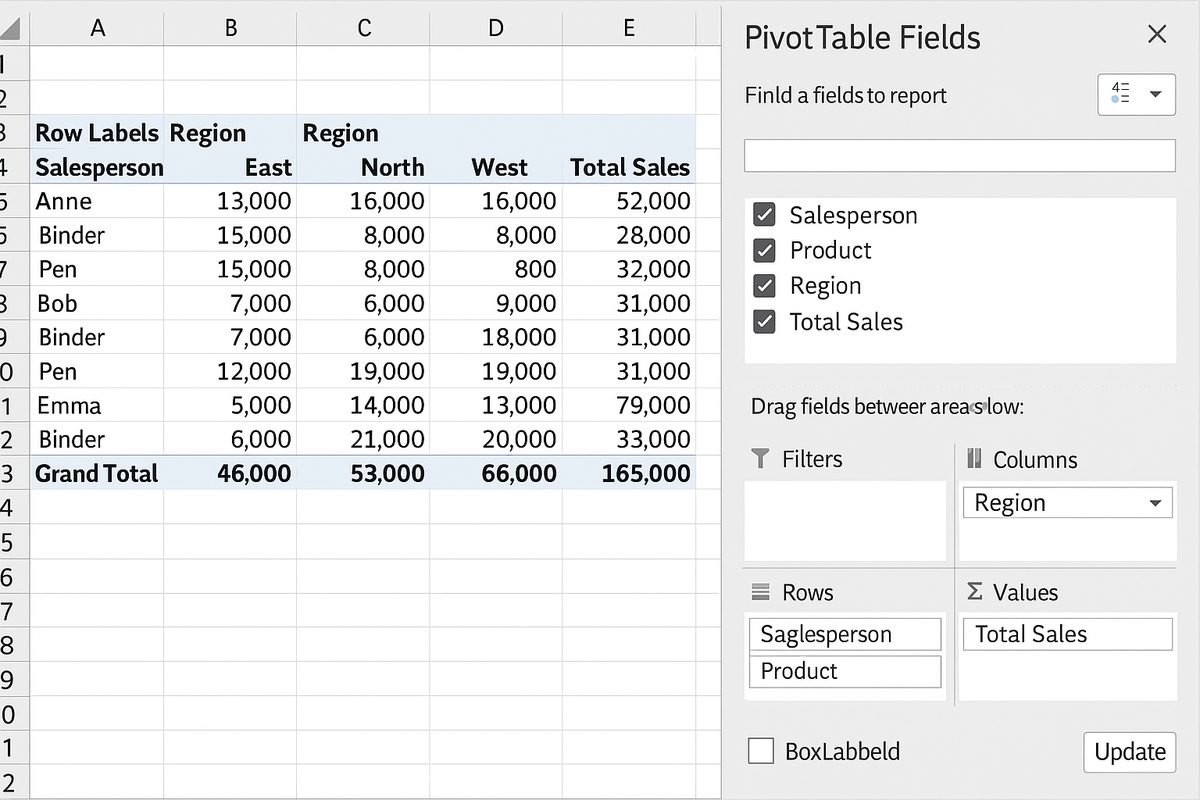
This setup will create a pivot table that shows total sales amounts by salesperson and product across regions.
Example: Analyzing Quarterly Sales
Suppose you want to analyze sales on a quarterly basis. Follow these steps:
- Ensure your Order Date column contains valid Excel dates.
- In the PivotTable Fields pane, drag Order Date to the Rows area.
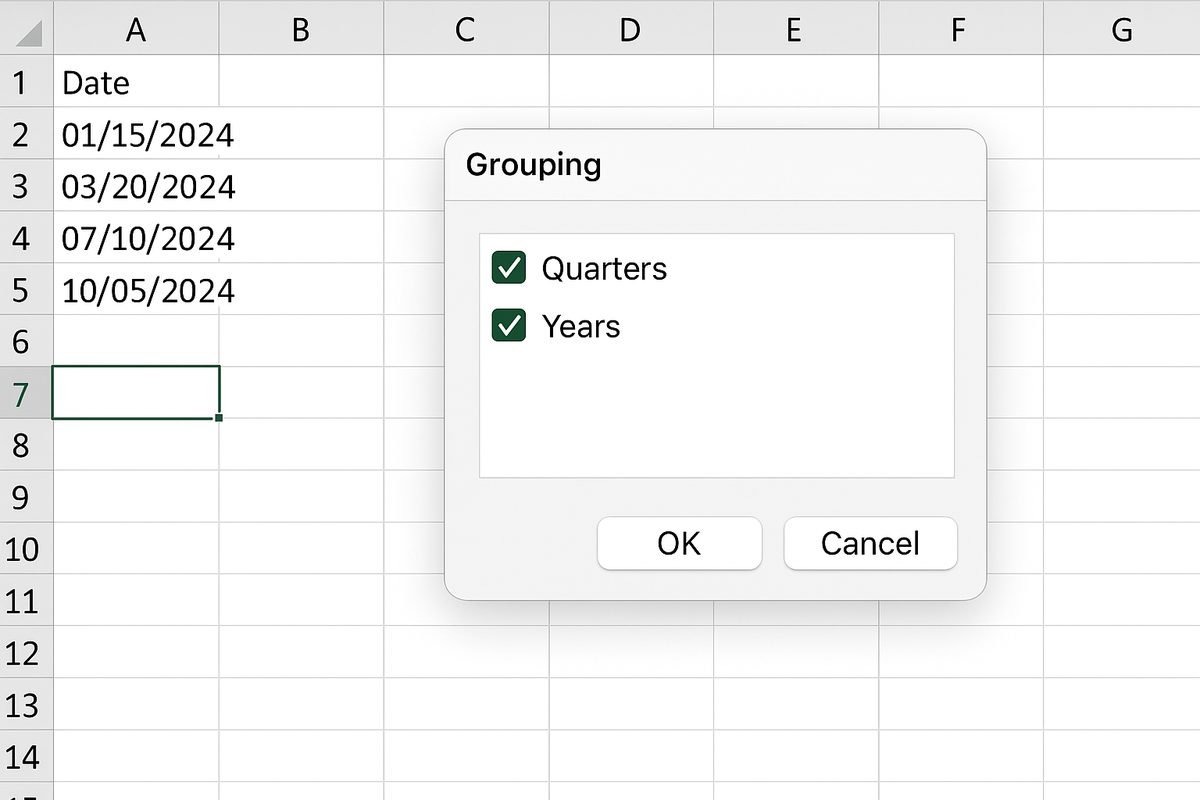
- Right-click any date in the pivot table, select Group.
- In the Grouping dialog box, select Quarters and Years, then click OK.
The pivot table will now display sales data grouped quarterly, making it easier to visualize seasonal trends.
Step 4: Customizing and Formatting Your Report
To make your pivot table sales report more readable and professional:
- Use the Design tab to apply pivot table styles.
- Format the Total Sales values as currency.
- Add data labels and subtotals to clarify data breakdowns.
- Use slicers for interactive filtering by salesperson, product, or region.
Step 5: Updating Your Sales Report
When your sales data changes or expands, update the pivot table by:
- Clicking anywhere inside the pivot table.
- Going to the Analyze tab and selecting Refresh.
- If data range has expanded, adjust the source data range via Change Data Source.
Benefits of Using Pivot Table Sales Reports
- Efficiency: Quickly summarize large volumes of sales data.
- Flexibility: Easily rearrange data fields for different perspectives.
- Accuracy: Automatically calculates sums, averages, and counts.
- Dynamic Reporting: Interactive filtering and grouping options.
Common Use Cases for Pivot Table Sales Reports
Pivot tables can be used to:
- Track sales performance by salesperson or team.
- Analyze product performance across different regions.
- Compare sales trends over time (monthly, quarterly, yearly).
- Identify best-selling products or underperforming areas.
- Forecast sales and inventory needs.
Conclusion
Creating a pivot table sales report in Excel is an invaluable skill for anyone working with sales data. Pivot tables simplify complex data analysis, provide quick insights, and improve decision-making processes. By following the steps outlined in this article, you can efficiently transform raw sales data into meaningful reports that drive business growth.
FAQ
1. What data format is best for creating pivot tables?
The best format is a clean, tabular dataset with column headers and no blank rows or columns. Dates should be properly formatted as Excel-recognized dates.
2. Can pivot tables handle real-time sales data?
Pivot tables do not update automatically in real-time but can be refreshed manually or through VBA macros to reflect updated data.
3. How do I add calculated fields in a pivot table sales report?
You can add calculated fields via the PivotTable Analyze tab by selecting “Fields, Items, & Sets” and then “Calculated Field” to create custom calculations.
4. Can I use pivot tables to compare sales between different time periods?
Yes, by grouping date fields by months, quarters, or years, you can compare sales performance across different periods effectively.
5. How do slicers enhance pivot table sales reports?
Slicers provide an intuitive visual way to filter pivot table data interactively, improving report usability and analysis speed.
Related Articles
- Pivot Tables Tutorial: A Beginner’s Guide to Summarizing Data
- What Is a Pivot Table and How Can It Help You Analyze Data?
- How to Create a Pivot Table in Excel Step-by-Step
- Understanding Pivot Table Fields: Rows, Columns, Filters, and Values Explained
- Advanced Pivot Table Techniques to Master Data Analysis