Using VBA to Automate Data Analysis in Excel

Introduction
Excel is one of the most widely used tools for data analysis across industries. While manual data processing works for small datasets, automating data analysis using Excel VBA (Visual Basic for Applications) can save time, reduce errors, and boost productivity. In this article, we explore how to leverage Excel VBA data analysis techniques to automate repetitive tasks, perform complex calculations, and generate insightful reports.
What is Excel VBA Data Analysis?
Excel VBA data analysis refers to using VBA programming to manipulate, process, and analyze data within Excel workbooks. VBA enables users to write macros that automate tasks such as sorting, filtering, summarizing, and visualizing data. This automation helps handle large datasets efficiently and allows customized workflows tailored to specific business needs.
Benefits of Using VBA for Data Analysis in Excel
- Automation: Automate repetitive tasks like formatting, filtering, and report generation.
- Efficiency: Process large datasets much faster than manual operations.
- Customization: Create tailored functions and procedures for unique data analysis requirements.
- Reproducibility: Execute the same analysis consistently to ensure data integrity.
- Integration: Combine Excel’s native features with VBA for enhanced functionality.
Getting Started with VBA for Data Analysis
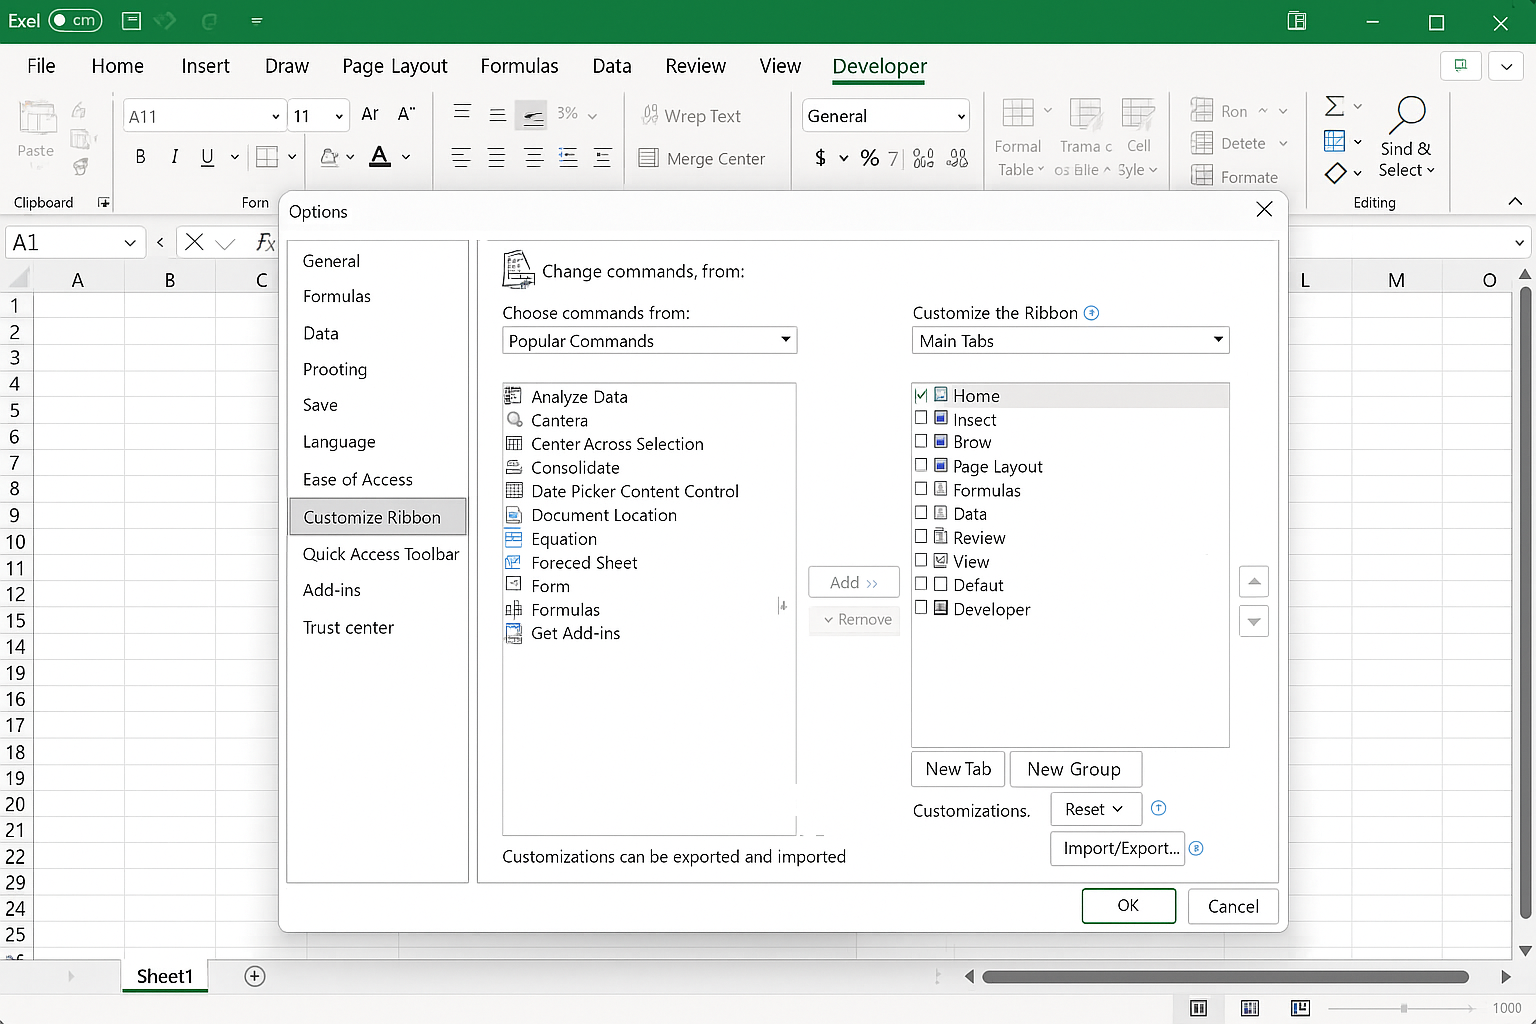
Before diving into automation, you need to enable the Developer tab in Excel, which provides access to the Visual Basic Editor (VBE) and macro recording tools.
- Go to File > Options > Customize Ribbon.
- Check the Developer option and click OK.
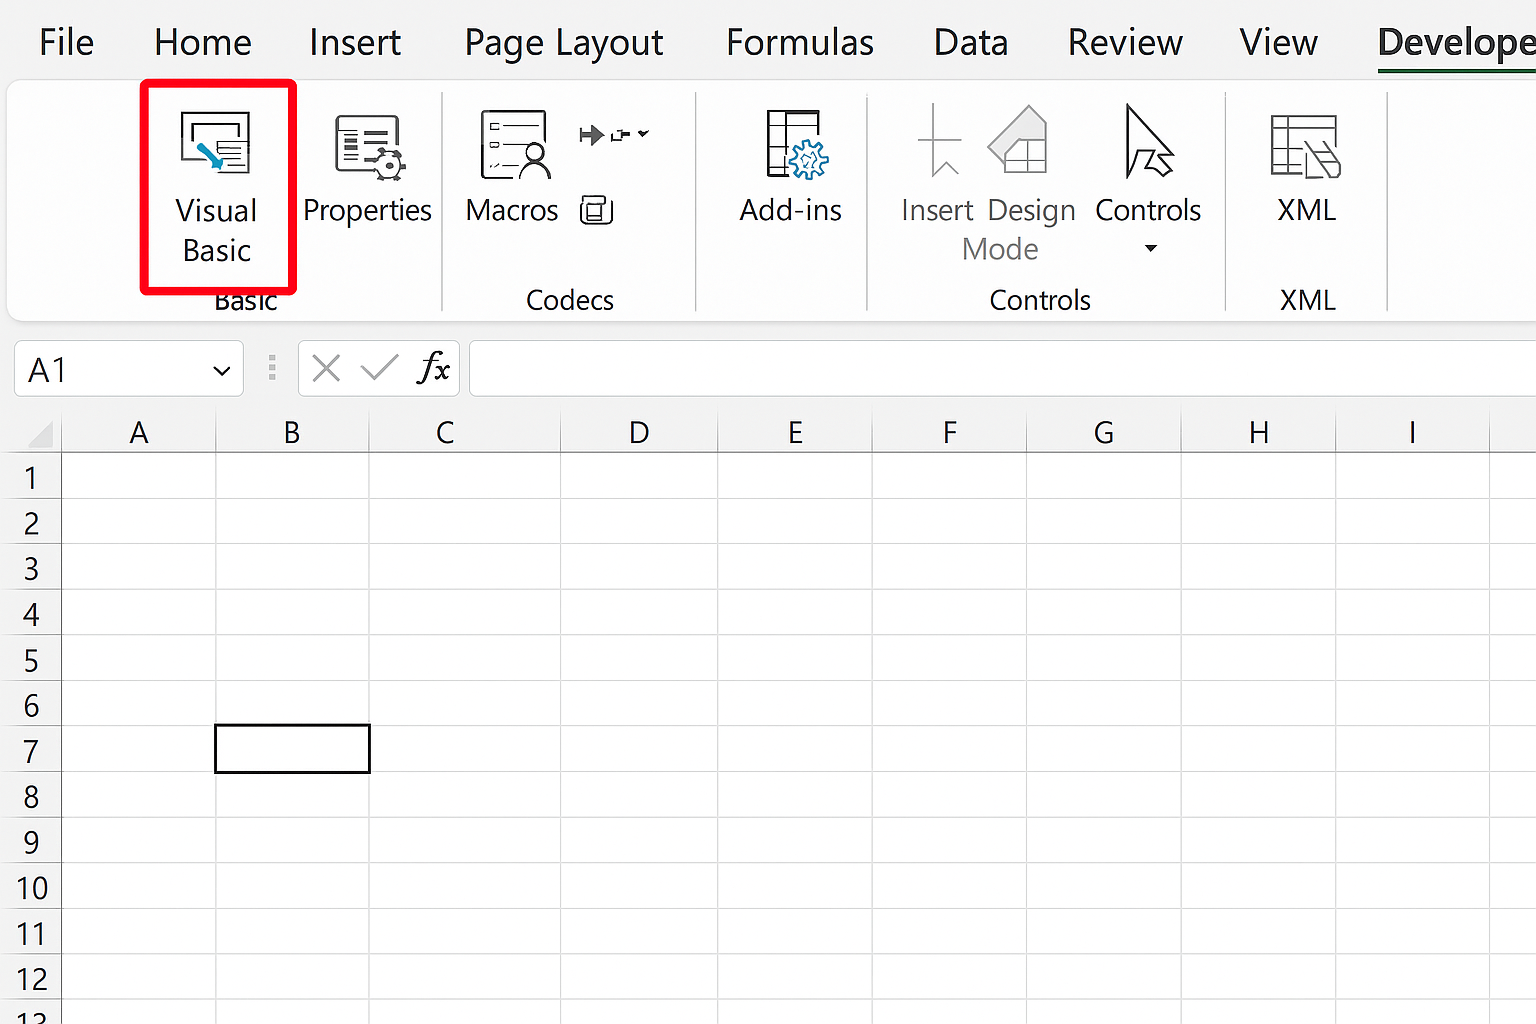
- Open the Developer tab and click on Visual Basic to launch the VBE.
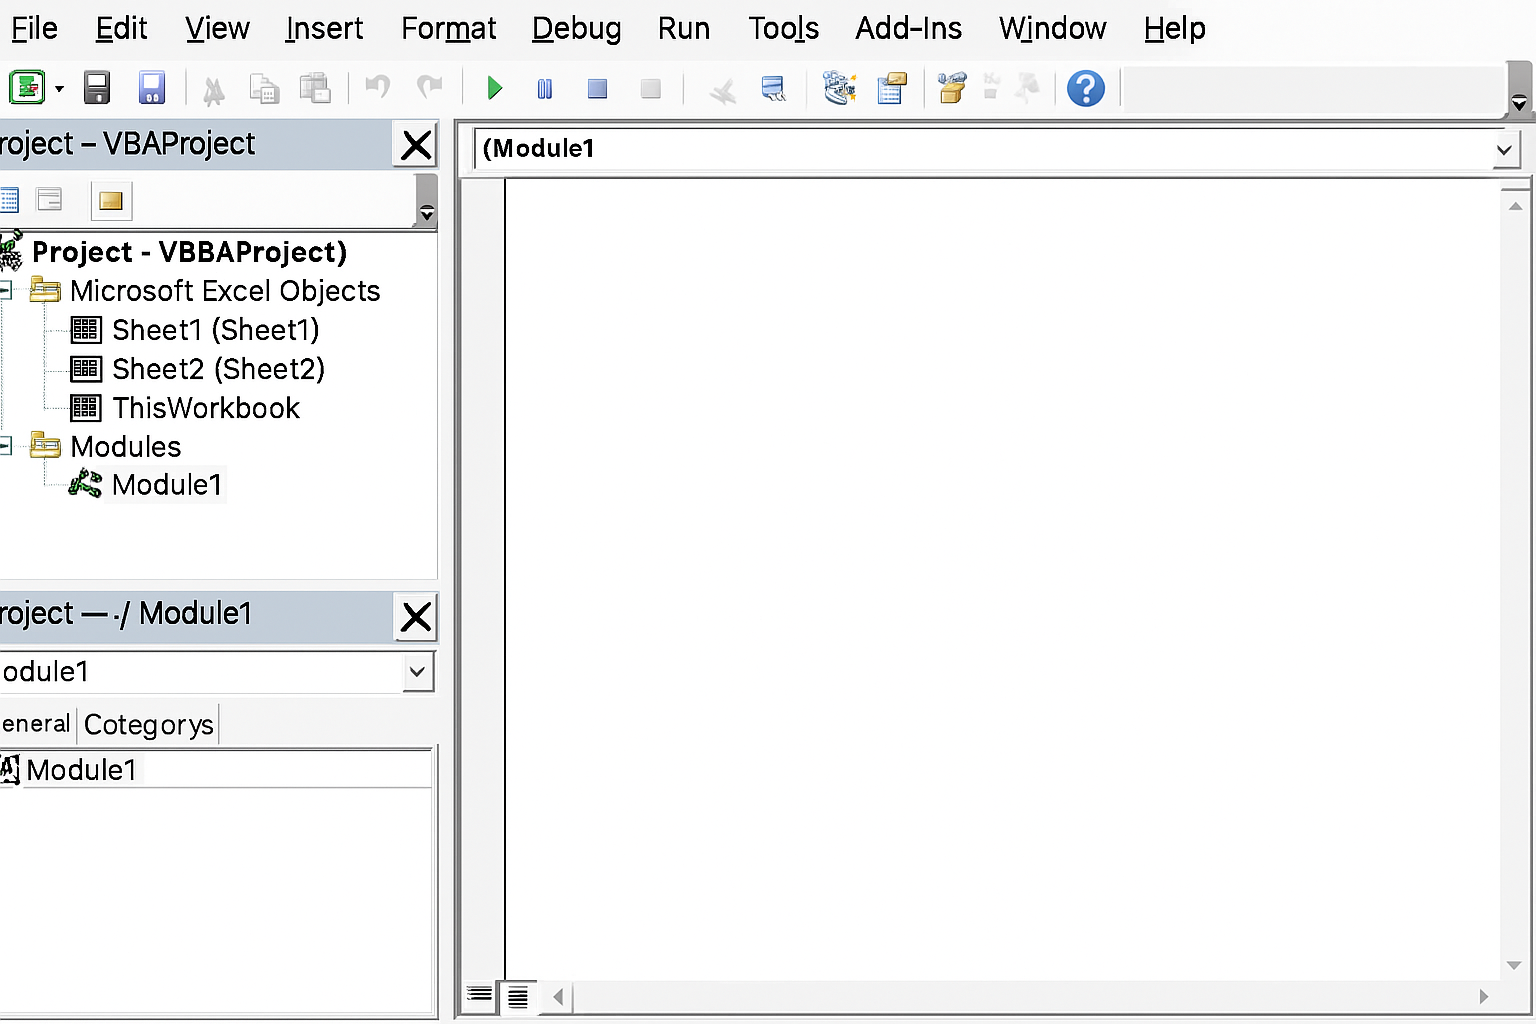
- Create a new Module to start writing your VBA code.
Alternatively, you can record macros to get a basic script and then modify it for more advanced data analysis tasks.
Practical Examples of Excel VBA Data Analysis
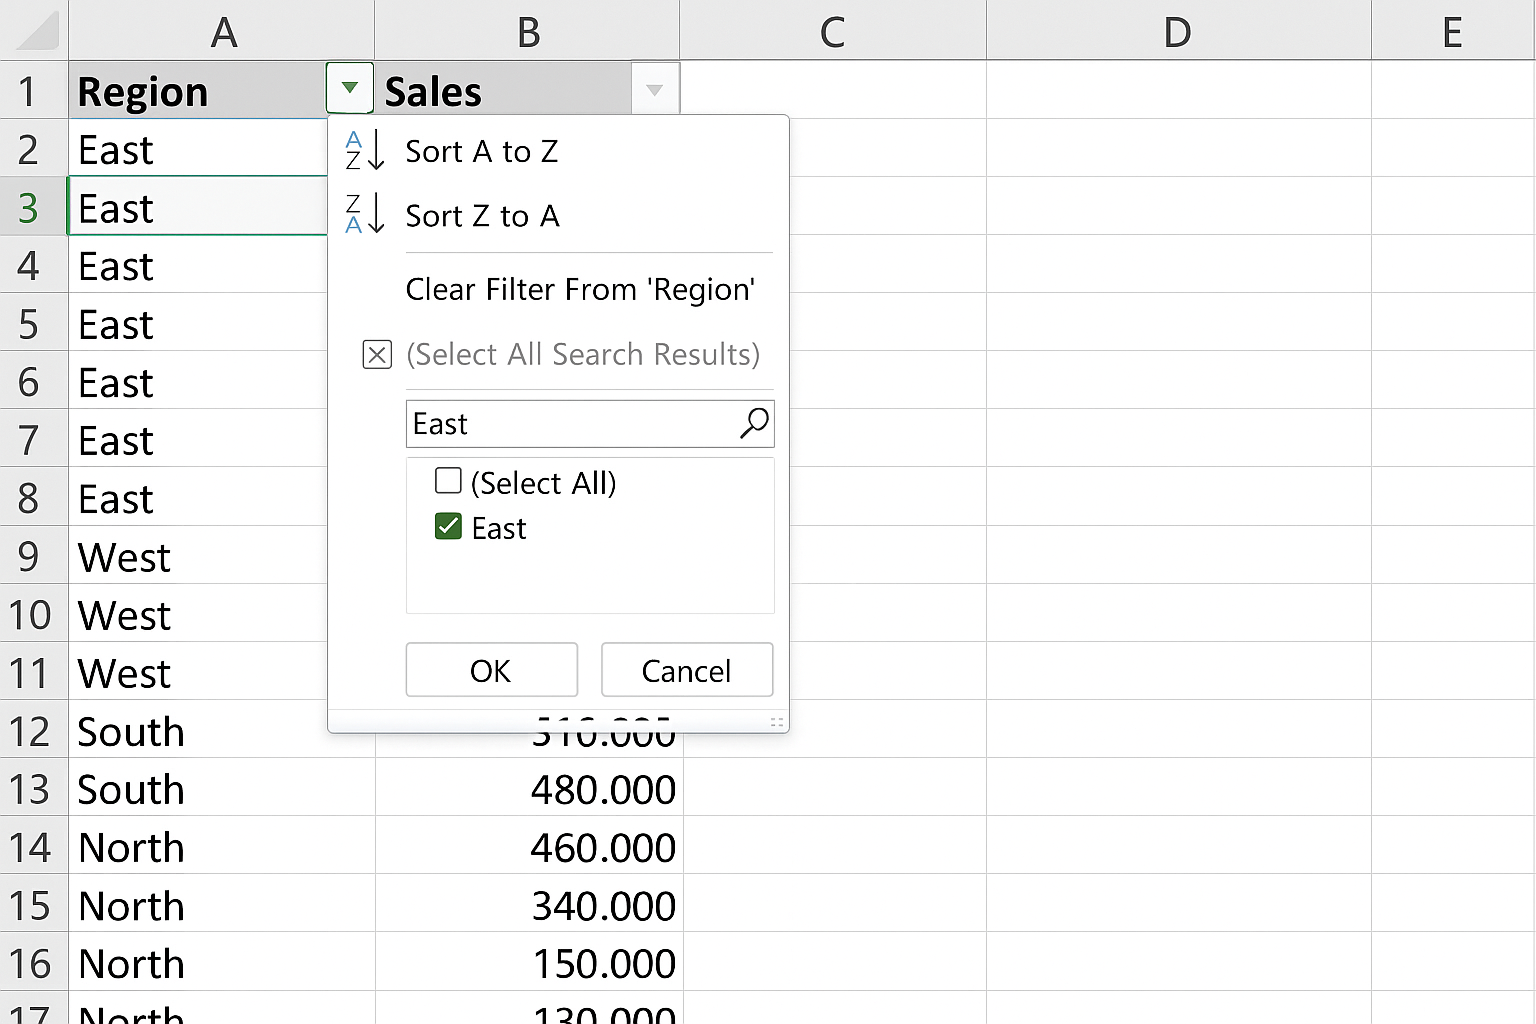
Example 1: Automating Data Sorting and Filtering
This macro sorts a dataset by the “Sales” column in descending order and filters records where “Region” equals “East”.
Sub SortAndFilterData()
    Dim ws As Worksheet
    Set ws = ThisWorkbook.Sheets("SalesData")

    ' Remove any existing filters
    ws.AutoFilterMode = False

    ' Sort by Sales column (assumed column C)
    ws.Range("A1").CurrentRegion.Sort _
        Key1:=ws.Range("C2"), Order1:=xlDescending, Header:=xlYes

    ' Apply filter on Region column (assumed column B)
    ws.Range("A1").CurrentRegion.AutoFilter _
        Field:=2, Criteria1:="East"
End Sub
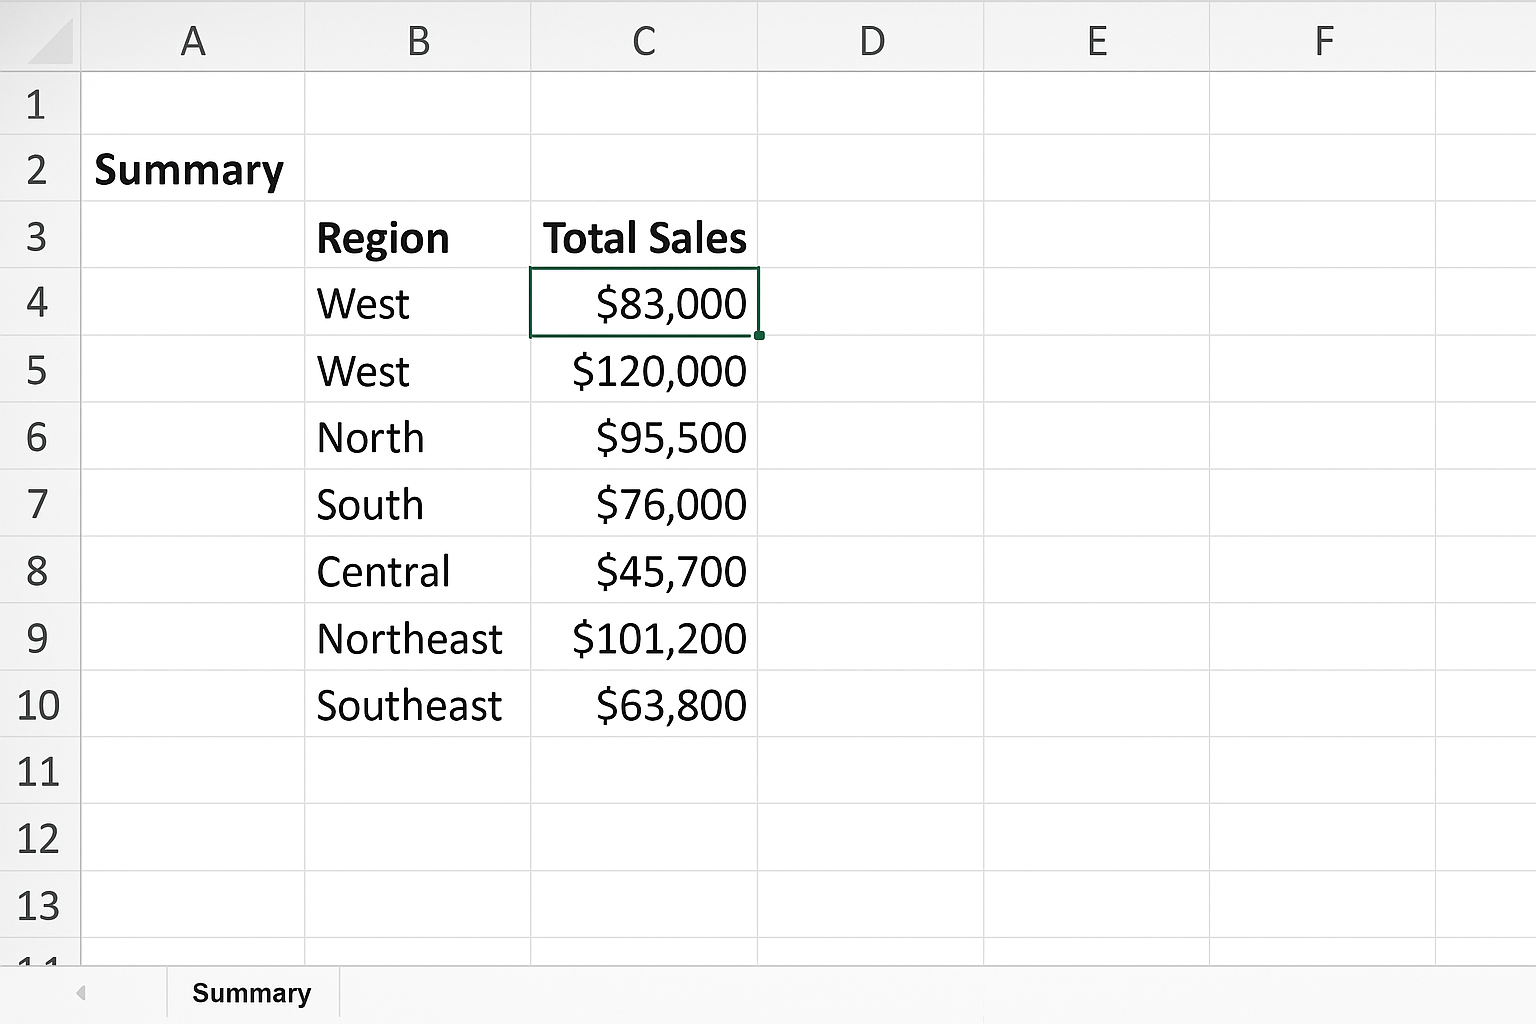
Example 2: Summarizing Data with VBA
This macro calculates the total sales by region and outputs the summary to a new worksheet.
Sub SummarizeSalesByRegion()
    Dim wsData As Worksheet, wsSummary As Worksheet
    Dim dict As Object
    Dim lastRow As Long, i As Long
    Dim region As String, sales As Double

    Set wsData = ThisWorkbook.Sheets("SalesData")
    On Error Resume Next
    Application.DisplayAlerts = False
    Worksheets("Summary").Delete
    Application.DisplayAlerts = True
    On Error GoTo 0
    Set wsSummary = ThisWorkbook.Sheets.Add
    wsSummary.Name = "Summary"

    Set dict = CreateObject("Scripting.Dictionary")

    lastRow = wsData.Cells(wsData.Rows.Count, "A").End(xlUp).Row

    For i = 2 To lastRow
        region = wsData.Cells(i, 2).Value ' Region in column B
        sales = wsData.Cells(i, 3).Value  ' Sales in column C
        If dict.Exists(region) Then
            dict(region) = dict(region) + sales
        Else
            dict.Add region, sales
        End If
    Next i

    wsSummary.Cells(1, 1).Value = "Region"
    wsSummary.Cells(1, 2).Value = "Total Sales"

    i = 2
    Dim key As Variant
    For Each key In dict.Keys
        wsSummary.Cells(i, 1).Value = key
        wsSummary.Cells(i, 2).Value = dict(key)
        i = i + 1
    Next key

    wsSummary.Columns("A:B").AutoFit
End Sub
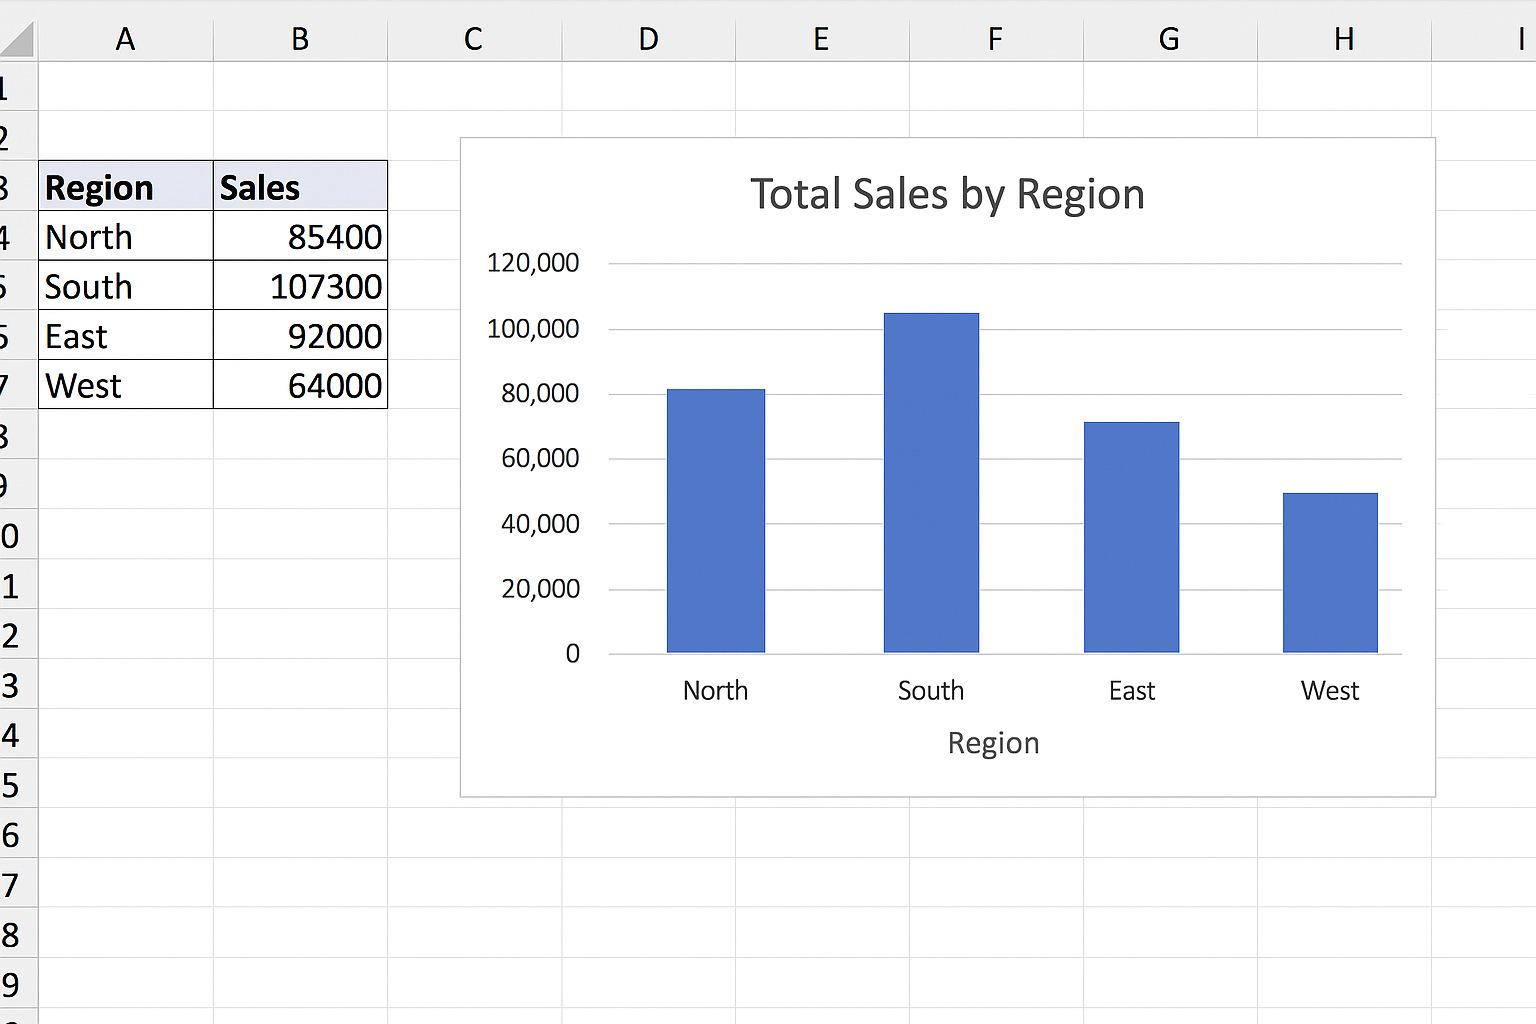
Example 3: Creating a Dynamic Chart with VBA
This macro creates a column chart showing total sales by region from the summary table.
Sub CreateSalesChart()
    Dim wsSummary As Worksheet
    Dim chartObj As ChartObject

    Set wsSummary = ThisWorkbook.Sheets("Summary")

    ' Delete existing charts
    For Each chartObj In wsSummary.ChartObjects
        chartObj.Delete
    Next chartObj

    Set chartObj = wsSummary.ChartObjects.Add(Left:=300, Width:=400, Top:=20, Height:=250)

    With chartObj.Chart
        .SetSourceData Source:=wsSummary.Range("A1:B" & wsSummary.Cells(wsSummary.Rows.Count, "A").End(xlUp).Row)
        .ChartType = xlColumnClustered
        .HasTitle = True
        .ChartTitle.Text = "Total Sales by Region"
        .Axes(xlCategory).HasTitle = True
        .Axes(xlCategory).AxisTitle.Text = "Region"
        .Axes(xlValue).HasTitle = True
        .Axes(xlValue).AxisTitle.Text = "Sales"
    End With
End Sub
Tips for Effective Excel VBA Data Analysis
- Use meaningful variable names: Improves code readability.
- Handle errors gracefully: Use error handling to avoid macro crashes.
- Comment your code: Document the purpose of complex sections.
- Optimize performance: Disable screen updating and automatic calculations during macro execution.
- Modularize your code: Break code into reusable subroutines and functions.
Common Challenges and How to Overcome Them
Working with Excel VBA for data analysis can present challenges such as handling large datasets that slow down macros, debugging complex code, and ensuring compatibility across Excel versions. To mitigate these issues:
- Use
Application.ScreenUpdating = FalseandApplication.Calculation = xlCalculationManualat the beginning of macros, and revert settings at the end. - Break data into smaller chunks if possible.
- Use the Debugger and
MsgBoxstatements to trace problems. - Test macros on different Excel versions if sharing files.
FAQ
What types of data analysis can be automated using Excel VBA?
You can automate sorting, filtering, summarizing, creating pivot tables, generating charts, applying formulas, and even advanced statistical calculations using VBA.
Is prior programming experience required to use VBA for data analysis?
Basic understanding of programming concepts helps, but many users start by recording macros and gradually learning to modify and write VBA code for custom tasks.
Can VBA handle large datasets efficiently?
Yes, VBA can manage large datasets, especially when combined with optimized code and techniques like disabling screen updating and calculation during execution.
How can I learn Excel VBA for data analysis effectively?
Practice by automating simple tasks, study existing VBA macros, use online tutorials, and gradually take on more complex projects to build your skills.
Are there security concerns when using VBA macros?
Macros can pose security risks if sourced from untrusted files. Always enable macros only from trusted sources and consider using digital signatures.
Conclusion
Excel VBA data analysis offers a powerful way to automate and enhance your data processing workflows. By mastering VBA programming, you can create customized solutions that save time, reduce errors, and unlock new insights from your data. Whether sorting and filtering datasets, summarizing information, or generating dynamic charts, VBA helps transform Excel into a robust data analysis tool tailored to your unique needs. Start experimenting with the practical examples provided and explore the vast potential of Excel VBA for your data analysis projects.
Related Articles
- How to Automate Repetitive Tasks in Excel Using VBA
- Creating Your First Macro in Excel with VBA: A Step-by-Step Guide
- Top 10 Simple VBA Scripts to Automate Excel Tasks for Beginners
- Using Loops in Excel VBA to Save Time on Data Entry
- Introduction to Excel VBA Programming for Absolute Beginners
Want practical Excel help?
Support free Excel tutorials, get weekly tips, or contact us for Excel programming, VBA, Power Query, dashboards, and automation work.