Pivot Tables Tutorial: A Beginner’s Guide to Summarizing Data
Introduction
Pivot tables are one of the most powerful tools in Microsoft Excel for data analysis and summarization. Whether you’re managing sales data, tracking expenses, or analyzing survey results, pivot tables can help you extract meaningful insights quickly and easily. This pivot tables tutorial is designed for beginners and will guide you through the basics of creating, customizing, and interpreting pivot tables to make your data work for you.
What Are Pivot Tables?
A pivot table is an interactive table that automatically sorts, counts, totals, or averages data stored in a spreadsheet and displays the summarized results. Unlike regular formulas, pivot tables let you reorganize and group data dynamically without changing the original dataset.
Why Use Pivot Tables?
- Quick Data Summarization: Instantly summarize large datasets without writing complex formulas.
- Flexible Data Analysis: Drag and drop fields to view data from different perspectives.
- Easy Reporting: Generate clear reports that can be updated automatically as data changes.
Getting Started: Creating Your First Pivot Table
Follow these simple steps to create a pivot table in Excel:
- Prepare Your Data: Ensure your dataset is organized with clear column headers and no blank rows or columns.
- Select Your Data Range: Click anywhere inside your data table.
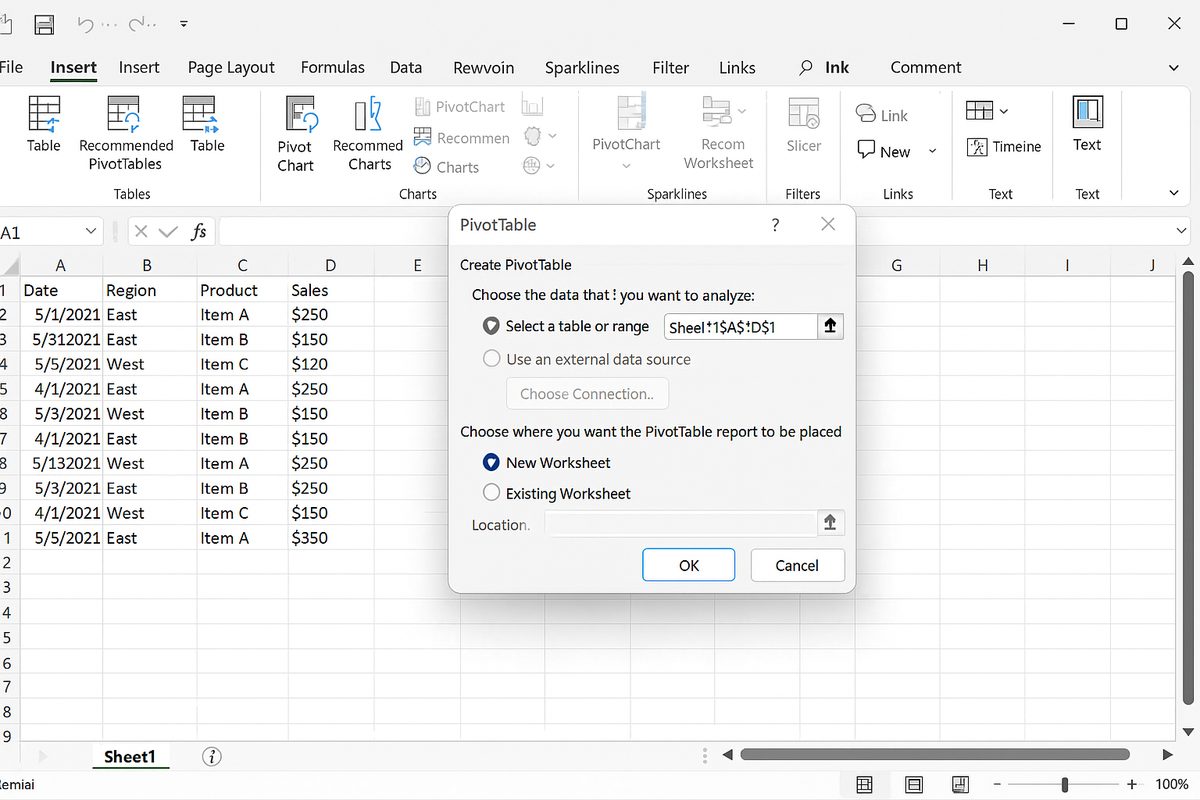
- Insert Pivot Table: Go to the Insert tab and click PivotTable. In the dialog box, confirm the data range and choose where you want the pivot table to be placed.
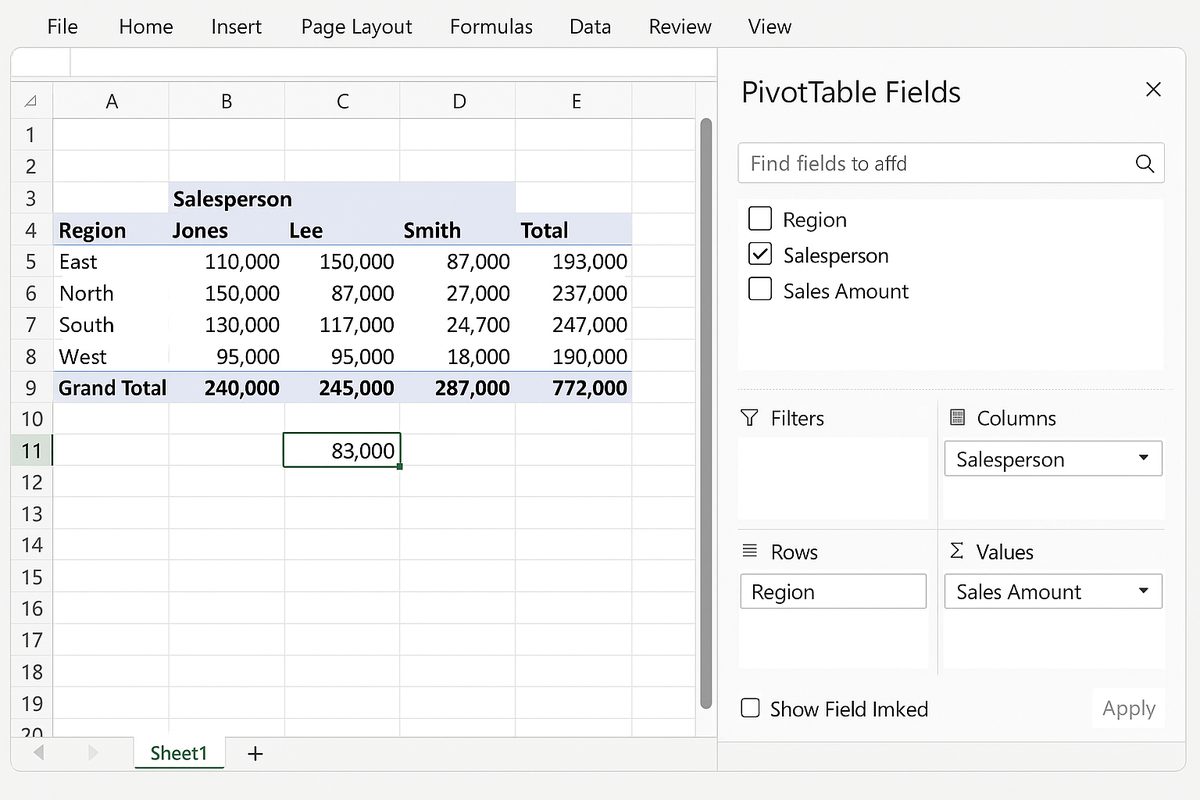
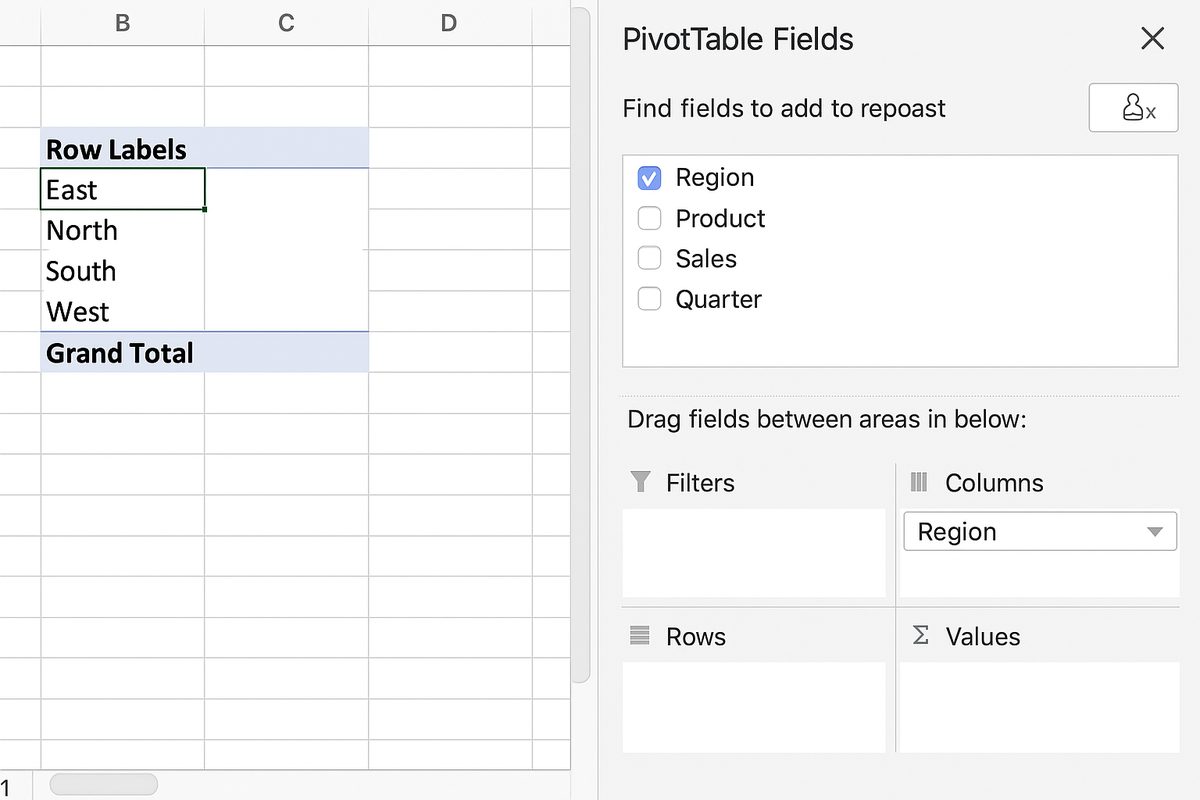
- Configure Your Pivot Table: The PivotTable Fields pane will appear, showing all columns from your data. Drag fields into the Rows, Columns, Values, and Filters areas to build your table.
Understanding Pivot Table Areas
- Rows: Fields placed here define the row labels and group your data horizontally.
- Columns: Fields here create column labels and group data vertically.
- Values: This is where numeric data goes; Excel summarizes these values using sums, counts, averages, etc.
- Filters: Allows you to filter the entire pivot table by specific criteria.
Practical Example: Sales Data Summary
Imagine you have sales data with columns: Date, Salesperson, Region, and Sales Amount. Here’s how to create a pivot table to analyze total sales by region and salesperson:
- Select your data range.
- Insert a pivot table on a new worksheet.
- Drag Region to the Rows area.
- Drag Salesperson to the Columns area.
- Drag Sales Amount to the Values area. Excel will automatically sum the values.
The resulting pivot table will show total sales broken down by region in rows and by salesperson in columns, allowing you to quickly compare performance.
Customizing Your Pivot Table
To make your pivot table more readable and tailored to your needs, you can:
- Change Summary Functions: Click the drop-down in the Values area, select Value Field Settings, and choose sum, count, average, max, min, etc.
- Apply Filters: Drag fields to the Filters area to add interactive filters.
- Format Numbers: Use the Number Format option in Value Field Settings to format currency, percentages, or decimals.
- Group Data: Right-click a row or column label and select Group to group dates by months or numbers by ranges.
- Refresh Data: When your source data updates, right-click the pivot table and select Refresh to update your summary.
Tips for Effective Pivot Tables
- Keep Data Clean: Avoid blank cells and ensure consistent data types in columns.
- Use Named Ranges: To make your pivot table dynamic, use named ranges or Excel tables as your data source.
- Limit Data Size: Large datasets can slow down pivot tables. Use filters or data subsets when necessary.
- Practice: Experiment with dragging different fields to rows, columns, values, and filters to discover new insights.
Common Errors and How to Fix Them
- Blank Rows in Source Data: Can cause incomplete pivot tables. Remove blank rows.
- Incorrect Data Types: Numbers stored as text won’t summarize correctly. Convert text to numbers.
- Pivot Table Not Refreshing: Remember to manually refresh or enable automatic refresh when source data changes.
Conclusion
Pivot tables are essential for anyone looking to summarize, analyze, and visualize data in Excel without complex formulas. This pivot tables tutorial has provided a clear pathway for beginners to create pivot tables, customize them, and use them effectively for data-driven decision making. By mastering pivot tables, you can turn raw data into powerful reports and insights that save time and increase productivity.
Frequently Asked Questions
Related Articles
- What Is a Pivot Table and How Can It Help You Analyze Data?
- How to Create a Pivot Table in Excel Step-by-Step
- Understanding Pivot Table Fields: Rows, Columns, Filters, and Values Explained
- Advanced Pivot Table Techniques to Master Data Analysis
- Using Calculated Fields in Pivot Tables to Perform Custom Calculations