What Is a Pivot Table and How Can It Help You Analyze Data?
Introduction If you have ever worked with large datasets in Excel, you might have heard the term “pivot table” but wondered exactly what it means…
Advertisement
Practical tutorials, real code samples, and AI-powered Excel tricks — for developers and power users who want to automate everything.
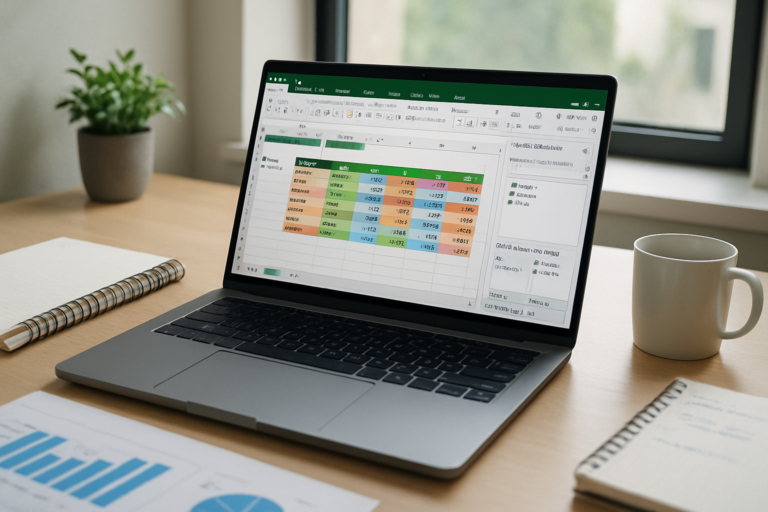
Introduction If you have ever worked with large datasets in Excel, you might have heard the term “pivot table” but wondered exactly what it means…
Introduction Pivot tables are one of the most powerful tools in Microsoft Excel for data analysis and summarization. Whether you’re managing sales data, tracking expenses,…
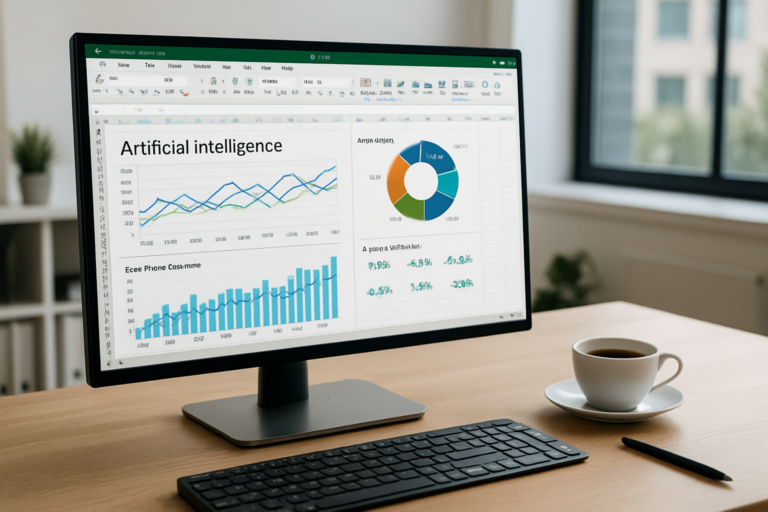
Introduction Excel remains one of the most powerful tools for data analysis and reporting, but the integration of Artificial Intelligence (AI) is transforming how users…
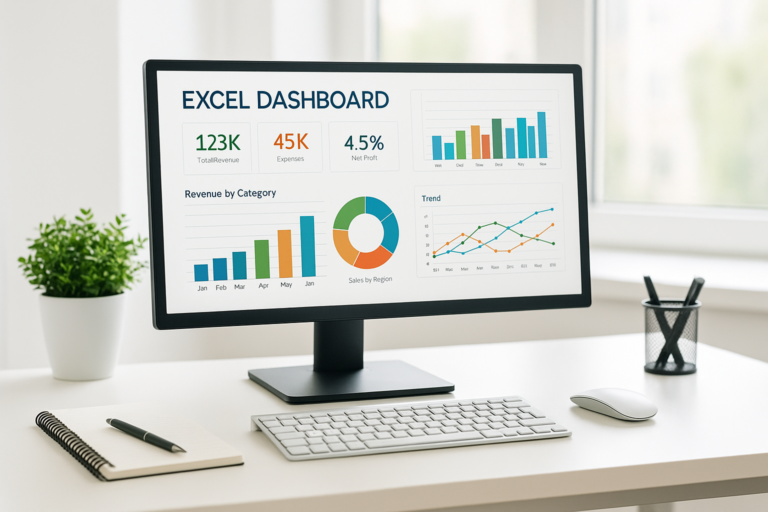
Introduction Excel dashboards are powerful tools that help you visualize data, track key performance indicators, and make data-driven decisions quickly. If you’re new to Excel…
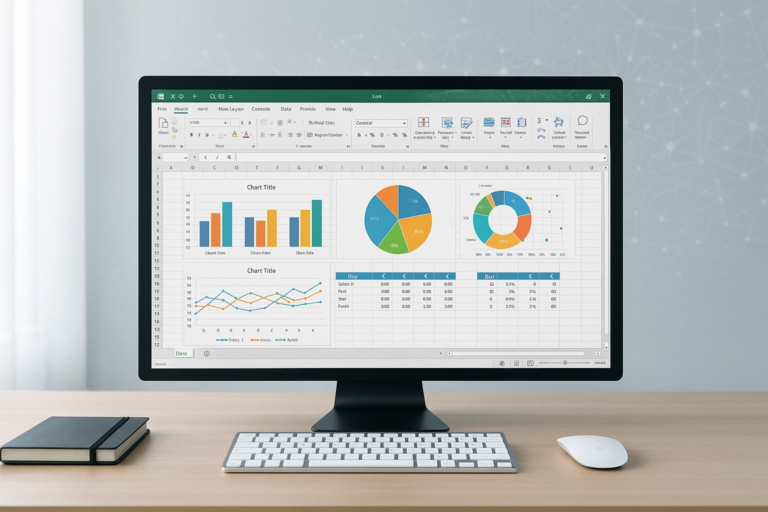
Introduction Excel dashboards are powerful tools that allow you to visualize complex data sets and present actionable insights in a clear and compelling manner. Building…
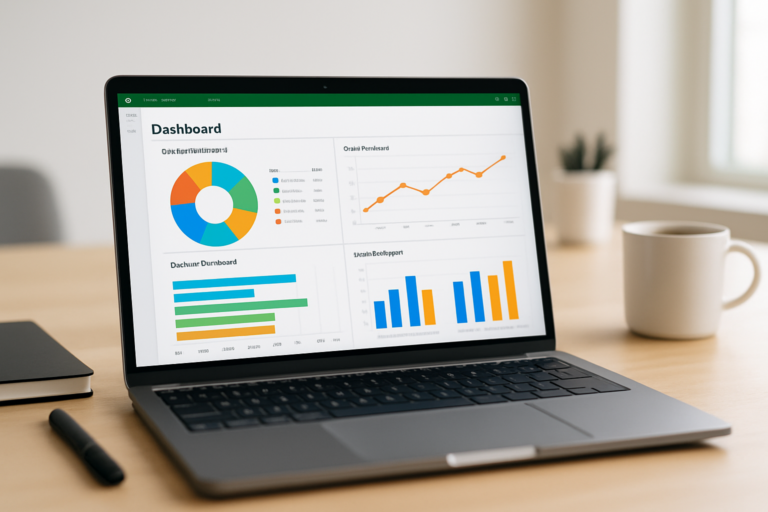
Introduction Excel dashboards are powerful tools that help visualize data, monitor key metrics, and make informed decisions. Whether you’re a beginner or an experienced Excel…
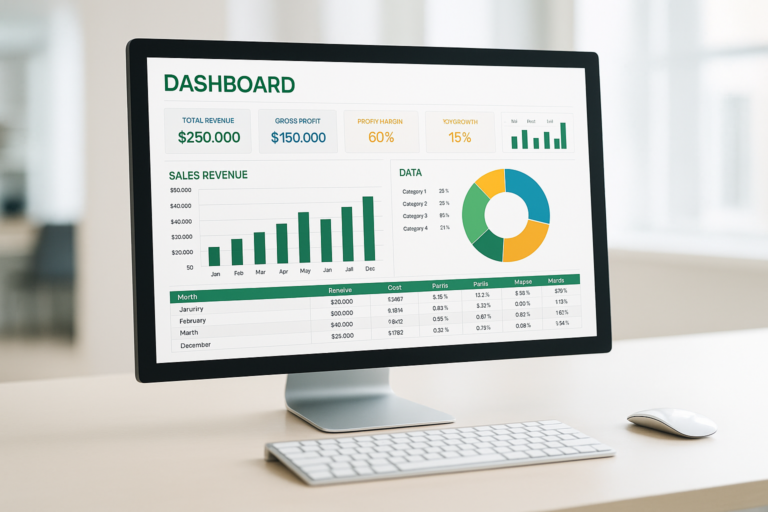
Introduction Creating an effective Excel dashboard is essential for visualizing data, making informed decisions, and tracking performance metrics efficiently. A well-designed dashboard not only displays…
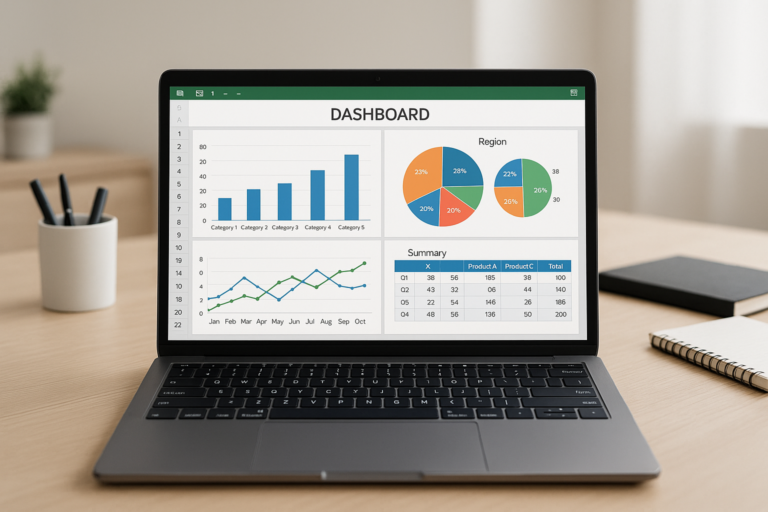
Introduction Creating an effective Excel dashboard layout is crucial for presenting data in a clear, concise, and visually appealing manner. A well-designed dashboard allows users…
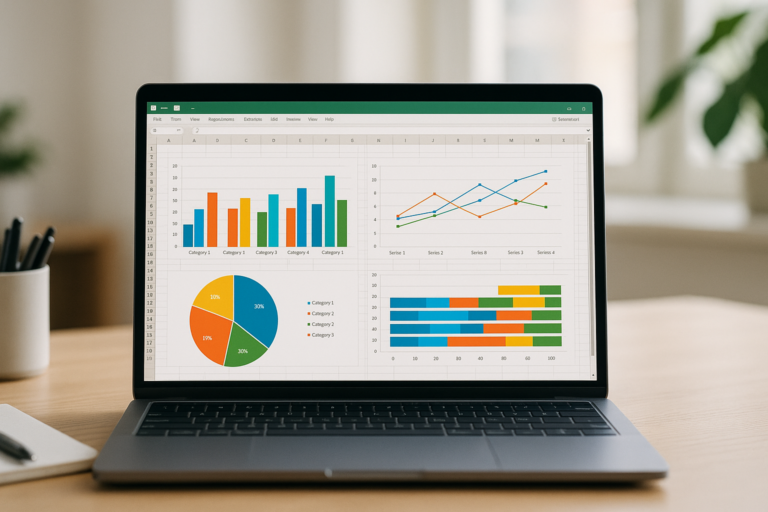
Introduction Excel dashboards are powerful tools for visualizing data and making insightful business decisions. One of the key elements that bring dashboards to life is…
Introduction Creating an effective Excel dashboard is essential for visualizing data, making informed decisions, and tracking performance metrics efficiently. A well-designed dashboard not only displays…
Join ExcelWiz updates for practical formulas, VBA, dashboards, and automation ideas.